Economy
Related: About this forumTaxes: Who Pays How Much in Eight Charts
http://smirkingchimp.com/thread/joshua-holland/56280/taxes-who-pays-how-much-in-eight-chartsTaxes: Who Pays How Much in Eight Charts
by Joshua Holland | June 7, 2014 - 10:09am
Ideological arguments about whether taxes are too high or too low miss the crucial question of who ends up bearing how much of the burden of financing our public sector.
There’s an inescapable reality surrounding that question: unlike corporations and the ultra-rich, America’s working majority have neither the lobbyists to write loopholes into the tax code, nor the financial planners and high-end tax accountants to exploit them.
The result, as economist Joseph E. Stiglitz tells Bill Moyers, is a system that is fundamentally unfair. Here are eight charts that illustrate how our tax burden has shifted over the years, and why we need to reform our tax code.
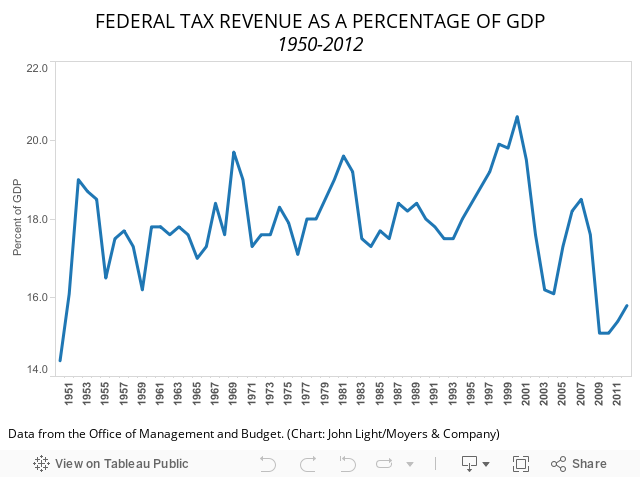
The US Is One of the Least Taxed Countries
Here’s some important context: Overall, we pay relatively little in taxes today compared to other wealthy countries.


 = new reply since forum marked as read
Highlight:
NoneDon't highlight anything
5 newestHighlight 5 most recent replies
= new reply since forum marked as read
Highlight:
NoneDon't highlight anything
5 newestHighlight 5 most recent replies
Scuba
(53,475 posts)
hobbit709
(41,694 posts)
brewens
(13,557 posts)those 400 people made derectly off us taxpayers? Forget subsidies. If they are invested heavily in companies that sell billions in weapons, fuel and services to the government, they rake in our tax dollars! Then they continue to claim to be taxed to death and threaten to take their ball and go home if we don't give them more breaks!
It's really upper middle class people that might be getting screwed the most. A couple that works extremely hard to make in the low six figures and can't take advantage of the loopholes the big players can. They pay full bore. Then all the while are terrorized by the right into thinking we want to take away what they've got.

chervilant
(8,267 posts)Getting "screwed the most"?
One less power lunch a week?
Belize instead of a private beach in Jamaica for vacation?
A new car every OTHER year?
(Economically speaking, I think we poor folks are suffering the most, and I'm no longer poor enough to fear homelessness every day, like I was two years ago...)
brewens
(13,557 posts)said some upper middle class people. I know some that have worked really hard to get there and some not so much. If they had rich parents that made college just like four or more extra years of high school and then got a head start with a nice inheritance, I can't say I feel real sorry for them. If the people at the top were actually paying their fair share, those upper middle class people would be a lot closer to the top than they are.

Festivito
(13,452 posts)First one, percent of GDP
Top countries include health care and retirement that we don't. The point that we pay less than other countries would probably remain. Just not as dramatically.
The chart of average federal tax rates..
Needs an associated chart of effective tax rates.
That top chart is like comparing grocery stores where the shopper only buys meat at our store and buys his fruits and vegetables from somewhere else. Then compares his bill to a Swedish store where he buys all three together.
L0oniX
(31,493 posts)