If this isn't enough to get it out, I have no idea what will do it. More stuff is coming in every few hours, too.
The first thing I'm going to point out is that the media is claiming the pollsters all got it "way wrong", especially the exit pollers, and in states Kerry was projected the clear winner by the exit polls, Bush won, often by a clear margin.
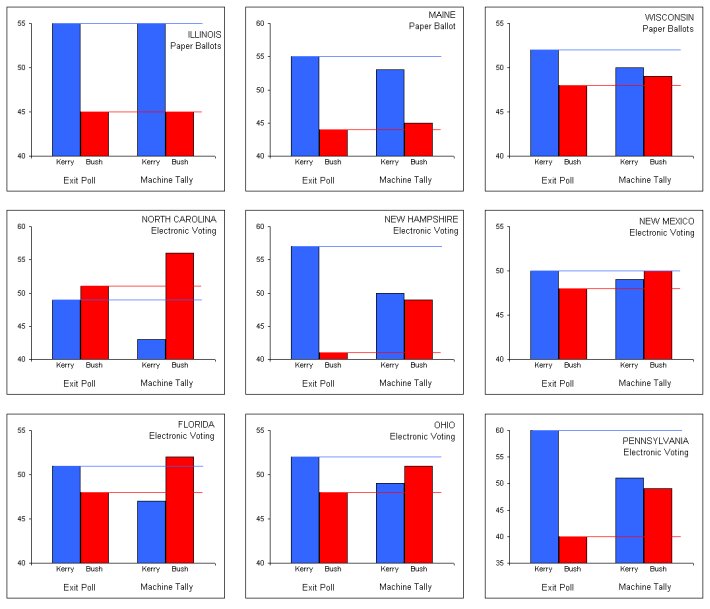
This is a lie. The exit polls were ONLY way off in states with electronic and optical scan voting. States with paper ballots were just fine, and the exit polls were almost never off more than 1 or 2 percent. This graph will help, taken from official election statistics and AP exit polls:
Next, here are some basic Florida election calcs, provided with sources at the bottom:
http://ustogether.org/Florida_Election.htmIn order to believe that these numbers are legit you have to believe that in Calhoun county, just as one example, which has 11.9% registered Republicans and 82.4% registered Democrats, voted in favor of Bush 3,780 to Kerry's 2,116.
To put that number more clearly for you, those numbers assume that even if every single one of the 994 registered Republicans (based on the 11.9 percent number) turned out AND voted for Bush (100 percent party loyalty and 100 percent turnout rate), 2,786 democrats crossed party lines and voted for Bush, and considering John Kerry only got 2,116 votes, that means he only got 43.2 percent of the Democratic vote. FOURTY THREE PERCENT. And that means the other 57 percent voted for Bush (minus 0.5 for Nader/Others). Do any of you buy all that? Also, while some of these counties did go to Bush in 2000 despite a heavy democrat registration favourability, they didn't go to him by NEARLY the numbers he got this year. Also, places where Dem registration was way up, like Miami-Dade county, Kerry didn't win by much. Somehow Bush managed to get tons of new voters from areas his registration didn't go up much in. Hmm?
Now, I know Independents are left out of this graph, but lets give George Bush the benefit of the doubt and assume that he carried the Independent chunk of the vote (20 percent or so at most) by 100 percent, EVERY SINGLE VOTE. In the county we just talked about that STILL would not get him NEARLY the vote he got, and that would mean Democrats turned out at about 35 percent to vote for Kerry. NOT. POSSIBLE.
Now here are a few media articles beginning to trickle out commenting on voting 'irregularities' -- Notice how these nearly always favour Bush, and these are only the ones we know about.
Broward County (HEAVILY democratic county in FL) machines count backwards:
http://www.palmbeachpost.com/politics/cont...WVOTE_1105.html638 Voters total in county, Bush got 4,258 (Ohio, of course!)
http://www.cnn.com/2004/ALLPOLITICS/11/05/...s.ap/index.htmlPalm Beach county FL somehow has 88k 'extra' votes to account for
http://www.washingtondispatch.com/spectrum...ves/000715.htmlEuropean commentary on some of the graphs from my earlier post, and other things. If you think WE don't believe in our system, imagine how these people are seeing this.
http://bellaciao.org/en/article.php3?id_article=4175*** This last bit was taken from TRUTHISALL's post, sorry I cleaned up the wording a little bit to make it more clear and less inflammatory. Also the summary is partly mine. ***
Exit poll numbers compared with final vote tally numbers:
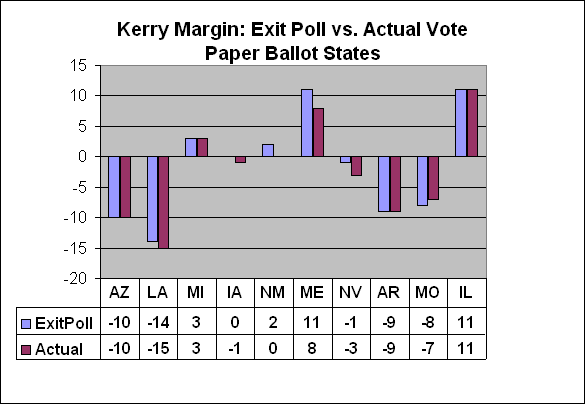
These are PAPER BALLOT states:
AZ LA MI IA NM ME NV AR MO IL
HERE ARE THE EXIT POLL AVERAGES FOR THESE STATES:
Exit poll
.....Kerry Bush
2pm 48.50 50.50
4pm 48.70 50.20
Final vote: Kerry 48.50, Bush 50.70
Not much change, right?
The EXIT POLLS did just fine, right?
Now check this out.
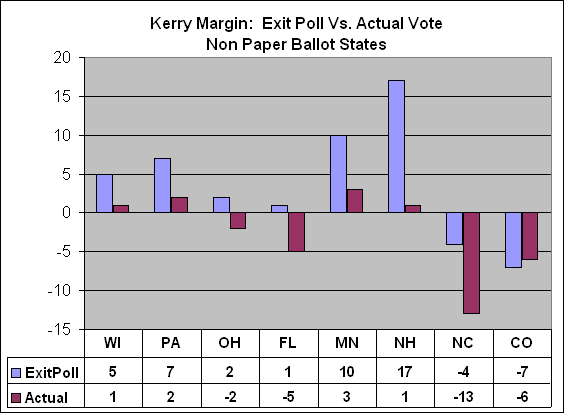
These are the NON-PAPER BALLOT states:
PA OH FL MN NC CO
HERE ARE THE EXIT POLL AVERAGES FOR THESE STATES:
Exit poll
.....Kerry Bush
2pm 53.50 45.88
4pm 51.50 47.63
Final: Kerry 48.38 Bush 50.75. The numbers get turned around for Bush. In fact, they look just like the final 51-48 result.
What happened here? Bush was losing in these very critical states, but then the EXIT POLLS started to change, unlike those in the paper ballot states in which the exit poll percentages held constant and were EXTREMELY ACCURATE until the polls closed.
Explain this, if you can: ONLY states without paper ballots suddenly started to move from Kerry to Bush.
Stumped? I'm not, but then, I'm not afraid to use the F word.