Saudi Arabian oil declines 8% in 2006
Posted by Stuart Staniford on March 2, 2007 - 10:10am
<snip>
The first possibility is that the Saudis could still pump 10 mbd or more today if they wanted to, but they are cutting back production and exploring like mad because they put an extremely high value on having 2-3 mbd of excess capacity. If so, the recent price behavior suggests that the reason they would seek such capacity is not because they want to stabilize the price, but because it puts them in an incredibly powerful negotiating position. For example, the ability at any time to flood the market could be used at an opportune moment to undercut expensive alternatives such as oil sands that require an oil price over $50.
The second and more natural interpretation is even more disturbing: the mighty Ghawar oil field is already in decline, and the Saudis don't want anyone to know.
What I did in this post was to look in more detail at what happened from the beginning of 2006 on, which is when the apparent decline begins. I added data from a fourth source (the OPEC Monthly Oil Market Review), and for each of the four sources of data, I fit a linear trend:
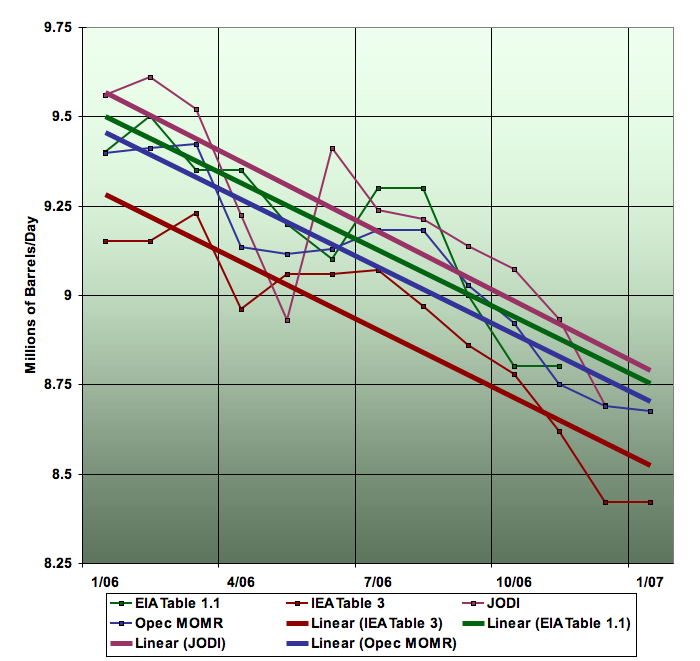
Saudi Arabian oil production, Jan 2006-Jan 2007, from four different sources. Linear trends fitted to each series. Graph is not zero-scaled to better show changes. Click to enlarge. Source: US EIA International Petroleum Monthly Table 1.1, IEA Oil Market Report Table 3, Joint Oil Data Initiative, OPEC Monthly Oil Market Report, Table 17 (or similar) on OPEC Supply.
The resulting graph is extremely striking, I think. The four different sources all estimate Saudi production slightly differently - they fluctuate in different ways month to month, and disagree over the absolute level (that last may be differences in exactly what is defined as oil). However, the regressions make clear that all four sources are in strong agreement about the nature of the decline. The slopes of the lines are very similar.
The implied decline rate through the year is 8% ± 0.1%. (Note that the year on year decline from 2005 to 2006 will only be about half that, as the decline only began at the beginning of 2006). As far as I know, there are no known accidents or problems that would explain any restrictions on oil supply, and the Saudis themselves have maintained publicly that their production is unproblematic and they intend to increase it.
http://www.theoildrum.com/node/2325This matters.