Democratic Underground Latest Greatest Lobby Journals Search Options Help Login
Google

Arctic Ice August 2010

Printer-friendly format Printer-friendly format
Printer-friendly format Email this thread to a friend
Printer-friendly format Bookmark this thread
This topic is archived.
Home » Discuss » Topic Forums » Environment/Energy Donate to DU
 
XemaSab Donating Member (1000+ posts) Send PM | Profile | Ignore Tue Aug-03-10 04:09 AM
Original message
Arctic Ice August 2010


Judging by glimpses through clouds, by images from USCG Healy and from the North Pole camera: most of the remaining Arctic ice is a meter thick or less; it is substantially covered in meltpools many of which connect with the sea through holes in the ice; if pushed completely together with no overlaps so as to eliminate all open ocean interstices it would be reduced in extent to about 60% or less of its current extent. That's about the area of the triangle in the map above.

My projection for ice extent is that the extent figures will trend downwards as ice melts at the fringes of a thin, loose pack in an Arctic that is averagely warmer than it was in 2007. By about the third week of August I expect the 2010 extent line to be crossing the 2007 line, as shown below.


http://www.science20.com/chatter_box/arctic_ice_august_2010
Printer Friendly | Permalink |  | Top
The Croquist Donating Member (1000+ posts) Send PM | Profile | Ignore Tue Aug-03-10 09:37 AM
Response to Original message
1. It's possible but I wouldn't bet on it.
Using IJIS numbers on 06/30/2010 the Arctic had 569,532 sq km less ice then on 06/30/2007 (9,432,188 versus 8,862,656). As of 07/31/2010 it had 546,718 more sq km (6,375,313 versus 6,922,031) for a net pickup of 916,875 sq km.

Again, using IJIS numbers, the minimum ice extent dates for the 8 years available are:

2002 09/09
2003 09/18
2004 09/11
2005 09/22
2006 09/14
2007 09/24
2008 09/09
2009 09/13

The average is about 09/15 meaning that we've got about 43 days left. In order to get to the 2007 min it will need to lose 2,476,563 sq km (2010 is 6,731,094 as of 08/02). From 2003 - 2009 (2002 not available) the average loss was 1,742,388 with the greatest being 2,288,281 in (2008).

The monthly NSIDC numbers will be out in a day or so.


http://www.ijis.iarc.uaf.edu/en/home/seaice_extent.htm
http://www.ijis.iarc.uaf.edu/seaice/extent/plot.csv

Printer Friendly | Permalink |  | Top
 
joshcryer Donating Member (1000+ posts) Send PM | Profile | Ignore Tue Aug-03-10 01:20 PM
Response to Reply #1
2. Seeing their update, I just might:
Printer Friendly | Permalink |  | Top
 
hatrack Donating Member (1000+ posts) Send PM | Profile | Ignore Tue Aug-03-10 01:49 PM
Response to Reply #2
3. No one could have forseen this! It's almost as if things were moving Faster Than Expected!
:eyes:
Printer Friendly | Permalink |  | Top
 
XemaSab Donating Member (1000+ posts) Send PM | Profile | Ignore Tue Aug-03-10 02:03 PM
Response to Reply #3
4. .
:D
Printer Friendly | Permalink |  | Top
 
pscot Donating Member (1000+ posts) Send PM | Profile | Ignore Tue Aug-03-10 03:51 PM
Response to Original message
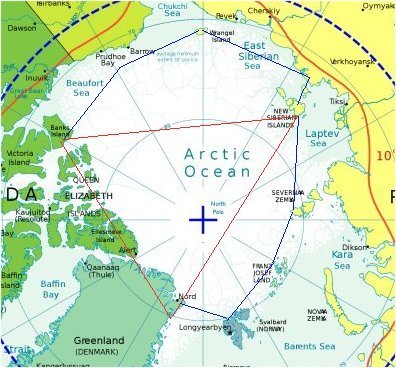
5. Here's the picture
Shocking

Printer Friendly | Permalink |  | Top
 
Nihil Donating Member (1000+ posts) Send PM | Profile | Ignore Wed Aug-04-10 04:18 AM
Response to Reply #5
7. Looks like a really bad case of mould
Question: What impact would it have if the two "inlets" of thin ice
meet up (i.e., the one from ~11 o'clock and the one from ~4 o'clock)?

Would the strain (tides/currents/gravity) on the weakened ice be enough
to split the ice cap across the middle or would that only come into
play much further down the line?
Printer Friendly | Permalink |  | Top
 
XemaSab Donating Member (1000+ posts) Send PM | Profile | Ignore Wed Aug-04-10 04:43 AM
Response to Reply #7
8. The cap stopped being a solid piece a month ago
Edited on Wed Aug-04-10 04:49 AM by XemaSab
Now it's little floaty chunks. x(

Here's a link:

http://rapidfire.sci.gsfc.nasa.gov/subsets/?mosaic=Arctic.2010215.terra.4km

Click to zoom in, then under "alternate pixel size" click on "250m" to get the super zoomed-in view.

It's cloudy as hell up there, but you should be able to get the idea.
Printer Friendly | Permalink |  | Top
 
Nihil Donating Member (1000+ posts) Send PM | Profile | Ignore Wed Aug-04-10 05:28 AM
Response to Reply #8
9. Sh!t ... I haven't looked at the detail for a while now ...
... and now wish I still hadn't ... "little floaty chunks" indeed, it looks
like someone's been crunching up polystyrene packing over a puddle ...
:-(
Printer Friendly | Permalink |  | Top
 
The Croquist Donating Member (1000+ posts) Send PM | Profile | Ignore Wed Aug-04-10 06:08 AM
Response to Reply #8
10. I wonder if that's why the Arctic explorers didn't walk to the North Pole in August?
Peary claimed to have reached it on April 6th. He started for it on February 28th and returned on April 23rd. That's February as in the month with the most ice.

Now think about it. In February it's still mostly dark up there and really, really cold. Why would someone want to walk in those conditions?

I wonder what he knew that we at DU don't?
Printer Friendly | Permalink |  | Top
 
pscot Donating Member (1000+ posts) Send PM | Profile | Ignore Wed Aug-04-10 10:11 AM
Response to Reply #5
11. The core seems to be that shelf
anchored across the top of Greenland and Baffin Island. The rest of it is just breaking up.
Printer Friendly | Permalink |  | Top
 
The Croquist Donating Member (1000+ posts) Send PM | Profile | Ignore Thu Aug-05-10 04:28 AM
Response to Reply #11
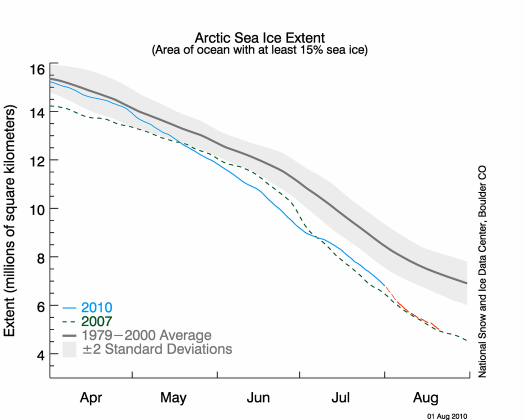
12. The NSIDC July ice numbers are in
The Sea Ice Extent for the Arctic was 8.4 million sq km. That is the second lowest in the 32 years of data with 2007 being the lowest at 8.1 million sq km. The average is 9.75 so it is at about 86% of average.

The Sea Ice Extent for the Antarctic was 17.2 million sq km. That is the highest in the 32 years of data with 2003 being the second highest at 16.9 million sq km. The average is 16.43 so it is at about 105% of average.

The global Sea Ice Extent was 25.6 million sq km. That is tied with 1990 & 2008 for the 7 lowest (26th highest)in the 32 years of data with 2007 being the lowest at 24.6 and 1979 the highest at 27.3 million sq km. The average is 26.18 so it is at about 98% of average.

http://nsidc.org/cgi-bin/bist/bist.pl?annot=1&legend=1&scale=100&tab_cols=1&tab_rows=32&config=seaice_index&submit=Refresh&mo0=01&hemis0=N&img0=extn&year0=2010&year1=2009&year2=2008

Printer Friendly | Permalink |  | Top
 
joshcryer Donating Member (1000+ posts) Send PM | Profile | Ignore Thu Aug-05-10 01:21 PM
Response to Reply #12
13. Mentioning Antarctic sea ice is telling.
It's a common talking point from a certain group. But the Antarctic does not play a big of a role in planetary albedo. Here are the real stats:

Arctic Sea Ice:


Antarctic Sea Ice:


And why is the Antarctic sea ice expanding? Oh, could it be because the Antarctic is losing ice mass at an accelerating rate?


http://www.skepticalscience.com/antarctica-gaining-ice.htm

Mentioning a "gain" in Antarctic sea ice as you are doing here implies that opposite, that there's some sort of equilibrium going on. There's not.
Printer Friendly | Permalink |  | Top
 
The Croquist Donating Member (1000+ posts) Send PM | Profile | Ignore Fri Aug-06-10 07:16 AM
Response to Reply #13
14. Fair enough
I brought up Antarctic sea ice to show that although the Arctic sea ice having a bad year the opposite is true in the south.

If you want to talk about land ice Velicogna 2009 did show that Antarctica was losing land ice but looking at eight years worth of data and projecting out seems a bit much.

Your Skeptical Science link includes these ominous words:
"This is significant because East Antarctica contains much more ice than West Antarctica. East Antarctica contains enough ice to raise global sea levels by 50 to 60 metres while West Antarctica would contribute around 6 to 7 metres."

And NASA themselves echos them:
"If all of this ice melted, it would raise global sea level by about 60 meter (197 feet)."

What neither of them mention is the time-frame involved.

Lets do a little math.

We'll start off with the fact that Antarctica contains allot of ice, approximately 30,000,000 km3. Now Velicogna 2009 doesn't look at volume but mass so we'll have to convert that into mass.

30,000,000 km3 equals 30,000,000,000,000,000 m3.

Now ice doesn't weigh as much as liquid water so we'll multiply that by 0.92 and come up with equivalent of 27,600,000,000,000,000 km3 of water.

Since a cubic meter of water weighs 1000 kilograms we know that 27,600,000,000,000,000 of water will weigh 27,600,000,000,000,000,000 kilograms.

But Velicogna 2009 doesn't talk kilograms they talk gigatons. A gigaton is 1,000,000,000 tons but which ton are the using? I'm going to assume a metric ton which is 1000 kg.

That done we divide 27,600,000,000,000,000,000 by 1,000,000,000 and come up with a mass of 27,600,000 gigatons.

Velicogna 2009 states that currently 246 Gt/yr (2006–2009). At that rate it will take only about 112,195 years to melt Antarctica and raise sea level 197 feet. That is the equivalent of 0.002 feet per year or about one eleventh the rate we have averaged for the last 20,000 years.

But wait, it's accelerating!!!!!!!

That's right it is accelerating at 26 ± 14 Gt/yr2. If it continues to accelerate at that rate in 3457 we can expect to have an ice free Antarctica. Thats just 1,447 years from now. Of course most of the melting and sea level rise will happen near the end. In 3456 for example we can expect to see 37,868 gigatons melt compared to the current rate of 246. That's assuming of course that:

1. The 9 years of data can be trended out for the next 1,500 years.
2. The estimates are accurate.

The acceleration estimate of 26 ± 14 Gt/yr2 has that whole ± in it. If you use the low end the Antarctic will last a bit longer until 4133. If you use the high end it only lasts until 3178.
Printer Friendly | Permalink |  | Top
 
joshcryer Donating Member (1000+ posts) Send PM | Profile | Ignore Fri Aug-06-10 09:28 PM
Response to Reply #14
15. Yeah, no one is worrying about a full melt of the Antarctic ice sheets.
What is interesting is that we thought they were relatively stable, they're not.
Printer Friendly | Permalink |  | Top
 
The Croquist Donating Member (1000+ posts) Send PM | Profile | Ignore Sat Aug-07-10 05:26 PM
Response to Reply #15
16. You don't think that something that varies by 1/112,195th is stable?
You look at 9 years of data and decide that it's not stable?
Printer Friendly | Permalink |  | Top
 
joshcryer Donating Member (1000+ posts) Send PM | Profile | Ignore Sat Aug-07-10 08:40 PM
Response to Reply #16
17. If it wasn't accelerating, then you'd have a point.
Printer Friendly | Permalink |  | Top
 
The Croquist Donating Member (1000+ posts) Send PM | Profile | Ignore Sun Aug-08-10 08:22 AM
Response to Reply #17
18. Projecting 9 years worth of data out for thousands of years is absurd.
You might as well look at 4 minutes of sunshine and decide that the sun will never set again.
Printer Friendly | Permalink |  | Top
 
joshcryer Donating Member (1000+ posts) Send PM | Profile | Ignore Sun Aug-08-10 06:43 PM
Response to Reply #18
20. Setting "full melt as an unstable indicator" is absurd.
It doens't have to melt fully to be "unstable." It merely has to melt more one year to the next with no evidence of slowing down.

What you seem to be suggesting is that I think that it will melt fully. No, all I am saying is that the evidence shows that the Antarctic is currently unstable year on year.

It could magically change, but I'd need to see evidence to that end.
Printer Friendly | Permalink |  | Top
 
The Croquist Donating Member (1000+ posts) Send PM | Profile | Ignore Mon Aug-09-10 07:53 AM
Response to Reply #20
22. My bad you're right
Edited on Mon Aug-09-10 07:56 AM by The Croquist
and to make it worse I thought about that while typing it. I apologize.

The problem is we don't really have predictions to compare to the models with a short enough time frame to be useful. IPCC says that sea level will rise 7.5 to 23.3 inches by 2100. Many other studies predict vastly more sea lever rise but at the current rate it will work out to about 11 inches.

By 2100 no one who is posting here will be around to find out who was right.

This thread and others have people in a panic predicting a record low for a lousy 9 year history of the Arctic. In fact 2010 is closer to a third straight rebound year they a record low. These are the numbers for 08/08:

2002 N/A
2003 7,032,031 sq km
2004 7,199,844 sq km
2005 6,513,906 sq km
2006 6,689,063 sq km
2007 5,649,063 sq km
2008 6,485,000 sq km
2009 6,566,719 sq km
2010 6,405,625 sq km

2010 is behind 2008 & 2009 by 79,375 & 161,094 sq km respectively but has 756,562 sq km more then 2007. The comments I'm reading about it looking like swiss cheese or mold is besides the point. At best, we can tell it usually looks like that in August. That's why the Arctic explorers went in late late winter and early spring. Do you think they wanted to walk in the dark? The submarine SSN-778, USS Skate, was able to surface at the North Pole on March 17, 1959.

Think how pissed Peary would have been had he gotten there in only to find out he needed a swimsuit on April 7, 1909.

The first submarine attempt to reach the North pole was the Diesel US O-12 in 1931. It was planned to surface through the polynyas to recharge the batteries and refresh the air. Nobody died but it was a failure. The point is they expected to be able to find enough open water to surface. They failed because of storm damage not too much ice.
Printer Friendly | Permalink |  | Top
 
Odin2005 Donating Member (1000+ posts) Send PM | Profile | Ignore Tue Aug-03-10 09:00 PM
Response to Original message
6. The ice cap is looking like Swiss cheese. Or slush.
This is really gonna suck.
Printer Friendly | Permalink |  | Top
 
The Croquist Donating Member (1000+ posts) Send PM | Profile | Ignore Sun Aug-08-10 02:31 PM
Response to Reply #6
19. Maybe not. 2010 is not a great year but it doesn't look to be 2007 either
http://www.ijis.iarc.uaf.edu/en/home/seaice_extent.htm

As of 08/07/2010 IJIS estimates the Arctic at 6,452,813 sq km of sea ice. On 08/07/2007 it had 5,724,688 sq km of sea ice. The difference of 728,125 is quite significant and is growing. These are the differences over the last week:

Date....2007.......2010.......Diff.
8/1 6,324,063 6,819,531 495,468
8/2 6,217,500 6,731,250 513,750
8/3 6,109,844 6,655,000 545,156
8/4 6,001,250 6,593,281 592,031
8/5 5,890,469 6,539,375 648,906
8/6 5,815,156 6,491,250 676,094
8/7 5,724,688 6,452,813 728,125

As you can see 2010 is doing better then 2007 and, at least for now, the gap is growing. On 08/03 I posted that the difference between 07/31/2007 & 07/31/2010 was 546,718 sq km (more for 2010). As of 08/07/2010 the difference is 728,125 more sq km.

I don't think it's "gonna suck".
Printer Friendly | Permalink |  | Top
 
joshcryer Donating Member (1000+ posts) Send PM | Profile | Ignore Sun Aug-08-10 06:45 PM
Response to Reply #19
21. Yes, it appears that it won't be as bad as 2007, now.
Nothing to see, move along, global warming is no big deal, etc, etc.
Printer Friendly | Permalink |  | Top
 
DU AdBot (1000+ posts) Click to send private message to this author Click to view 
this author's profile Click to add 
this author to your buddy list Click to add 
this author to your Ignore list Sun May 05th 2024, 06:35 AM
Response to Original message
Advertisements [?]
 Top

Home » Discuss » Topic Forums » Environment/Energy Donate to DU

Powered by DCForum+ Version 1.1 Copyright 1997-2002 DCScripts.com
Software has been extensively modified by the DU administrators


Important Notices: By participating on this discussion board, visitors agree to abide by the rules outlined on our Rules page. Messages posted on the Democratic Underground Discussion Forums are the opinions of the individuals who post them, and do not necessarily represent the opinions of Democratic Underground, LLC.

Home  |  Discussion Forums  |  Journals |  Store  |  Donate

About DU  |  Contact Us  |  Privacy Policy

Got a message for Democratic Underground? Click here to send us a message.

© 2001 - 2011 Democratic Underground, LLC