Democratic Underground Latest Greatest Lobby Journals Search Options Help Login
Google

So how did that global cooling bet work out? (RealClimate comments on 2 year old bet.)

Printer-friendly format Printer-friendly format
Printer-friendly format Email this thread to a friend
Printer-friendly format Bookmark this thread
This topic is archived.
Home » Discuss » Topic Forums » Environment/Energy Donate to DU
 
joshcryer Donating Member (1000+ posts) Send PM | Profile | Ignore Wed Nov-24-10 10:52 PM
Original message
So how did that global cooling bet work out? (RealClimate comments on 2 year old bet.)
Not sure if you guys saw this but I thought it was hilarious!

Two and a half years ago, a paper was published in Nature purporting to be a real prediction of how global temperatures would develop, based on a method for initialising the ocean state using temperature observations (http://www.nature.com/nature/journal/v453/n7191/abs/nature06921.html">Keenlyside et al, 2008) (K08). In the subsequent period, this paper has been highly cited, very often in a misleading way by http://climateprogress.org/2009/10/01/interview-with-dr-mojib-latif-global-cooling-revkin-morano-george-will/">contrarians (for instance, Lindzen http://www.heartland.org/events/WashingtonDC09/PDFs/Lindzen.pdf">misrepresents it on a regular basis). But what of the paper’s actual claims, how are they holding up?

(...)

However, with the publication of the October 2010 temperatures from HadCRUT, the first prediction period has now ended, and so the predictions can be assessed. Looking first at the global mean temperatures...


we can see clearly that while K08 projected 0.06ºC cooling, the temperature record from HadCRUT (which was the basis of the bet) shows 0.07ºC warming (using GISTEMP, it is 0.11ºC).

http://www.realclimate.org/index.php/archives/2010/11/so-how-did-that-global-cooling-bet-work-out/#more-5345


Bet over. :rofl:
Printer Friendly | Permalink |  | Top
geckosfeet Donating Member (1000+ posts) Send PM | Profile | Ignore Wed Nov-24-10 11:02 PM
Response to Original message
1. bet over - but nothing to laugh about
Printer Friendly | Permalink |  | Top
 
joshcryer Donating Member (1000+ posts) Send PM | Profile | Ignore Wed Nov-24-10 11:02 PM
Response to Reply #1
2. True...
...or maybe not. Fucking deniers have been using this for two years.
Printer Friendly | Permalink |  | Top
 
geckosfeet Donating Member (1000+ posts) Send PM | Profile | Ignore Wed Nov-24-10 11:04 PM
Response to Reply #2
3. yeah - that parts funny - watching the climate change is less funny
Of course it could change in a good way.
Printer Friendly | Permalink |  | Top
 
joshcryer Donating Member (1000+ posts) Send PM | Profile | Ignore Wed Nov-24-10 11:05 PM
Response to Reply #3
4. Eventually the scientists will be proven right.
Hopefully it's not too late when the people finally open their eyes.
Printer Friendly | Permalink |  | Top
 
upi402 Donating Member (1000+ posts) Send PM | Profile | Ignore Sat Nov-27-10 12:56 PM
Response to Reply #4
18. They re-elected Bush
I'm not too hopeful at the moment. 'Open eyes'... not our strong suit.
Printer Friendly | Permalink |  | Top
 
Nederland Donating Member (1000+ posts) Send PM | Profile | Ignore Thu Nov-25-10 05:28 AM
Response to Original message
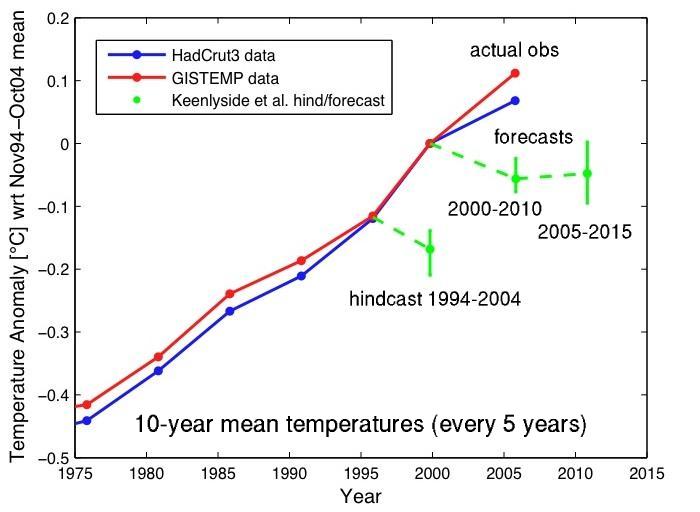
5. Where did you get the data for that graph?
I'm almost positive that is not what the GISTEMP and HadCrut3 records look like for that period, but it could simple be the choice of scale...
Printer Friendly | Permalink |  | Top
 
muriel_volestrangler Donating Member (1000+ posts) Send PM | Profile | Ignore Thu Nov-25-10 06:05 PM
Response to Reply #5
8. Those are the running 10 year averages, taken every 5 years
so the last point, for '2005', is the average from 2000-2010.

Here's a 10 year rolling average taken every month for the NASA GISS land-sea temperature anomaly data


(vertical scale is 100ths of a degree Celsius; horizontal scale marks every year, with 10 years as a major mark)
Printer Friendly | Permalink |  | Top
 
Nederland Donating Member (1000+ posts) Send PM | Profile | Ignore Thu Nov-25-10 10:06 PM
Response to Reply #8
10. Ten year averages, taken every 5 years?
I wonder why RC did that? Could it be that if you used the much more common metric of one or three year running averages, the results aren't nearly as impressive?


Nah, I'm sure Gavin has a really good reason for showing the data the way he did... :eyes:
Printer Friendly | Permalink |  | Top
 
joshcryer Donating Member (1000+ posts) Send PM | Profile | Ignore Thu Nov-25-10 11:28 PM
Response to Reply #10
11. They use the exact methodology the paper uses to make the comparison.
Are you seriously saying that they should not use the methodology that the paper uses to verify what the paper claims is a forecast? :eyes:
Printer Friendly | Permalink |  | Top
 
Nederland Donating Member (1000+ posts) Send PM | Profile | Ignore Sat Nov-27-10 01:52 AM
Response to Reply #11
14. No
Edited on Sat Nov-27-10 02:12 AM by Nederland
The question is this: what is the proper way of interpreting the forecast numbers. Yes, the paper is about creating decadal projections, but that does not imply that their projections are themselves 10 year means.

On Edit: Reading the paper I'm even more confused. Look at Figure 4 of the paper. It looks to me like they predicted temps would increase, not decrease...

Printer Friendly | Permalink |  | Top
 
joshcryer Donating Member (1000+ posts) Send PM | Profile | Ignore Sat Nov-27-10 04:20 AM
Response to Reply #14
16. The controversey was because they predicted there would be a decadal blip.
Basically "an entire decade without measurable temperature rises."

No model that even remotely incorporates a even sane concept of radiative forcing predicts adding more CO2 will make the planet cooler.
Printer Friendly | Permalink |  | Top
 
joshcryer Donating Member (1000+ posts) Send PM | Profile | Ignore Sat Nov-27-10 04:22 AM
Response to Reply #14
17. BTW, I don't have access to the paper, but the figures, I do.
It's at least obvious to me that they're doing what RC is claiming.
Printer Friendly | Permalink |  | Top
 
Nederland Donating Member (1000+ posts) Send PM | Profile | Ignore Mon Nov-29-10 03:49 AM
Response to Reply #17
23. Here is the paper
http://www.usclivar.org/Pubs/2May08Keenlyside.pdf

I wanted to read it for myself to see about RC using a decadal means. You were right, the paper was using decadal means, so comparing them against decadal means was the right thing to do. However, the projections in the paper displayed in figure 4 do not match those on the RC graph. Several posters on RC have made the same observation. I'm not sure why it was done the way it was...
Printer Friendly | Permalink |  | Top
 
joshcryer Donating Member (1000+ posts) Send PM | Profile | Ignore Tue Nov-30-10 06:15 AM
Response to Reply #23
25. Thanks, I see what you mean.
The forecast goes down on RC while it goes up in Fig. 4, I'll have to ask them about that.
Printer Friendly | Permalink |  | Top
 
joshcryer Donating Member (1000+ posts) Send PM | Profile | Ignore Fri Dec-03-10 07:51 PM
Response to Reply #23
33. He answered my question, btw.
Printer Friendly | Permalink |  | Top
 
muriel_volestrangler Donating Member (1000+ posts) Send PM | Profile | Ignore Fri Nov-26-10 02:58 AM
Response to Reply #10
12. "The climate of the North Atlantic region exhibits fluctuations on decadal timescales..."
"...that have large societal consequences". It's the opening sentence of the Keenlyside paper: http://www.nature.com/nature/journal/v453/n7191/abs/nature06921.html
Printer Friendly | Permalink |  | Top
 
joshcryer Donating Member (1000+ posts) Send PM | Profile | Ignore Thu Nov-25-10 06:50 PM
Response to Reply #5
9. RC.com had to fit the scaling, yeah. But they put up 2500 euros 2 years ago over this...
...it was ballsy to say the least.
Printer Friendly | Permalink |  | Top
 
guardian Donating Member (1000+ posts) Send PM | Profile | Ignore Thu Nov-25-10 01:17 PM
Response to Original message
6. no global warming since 1995
Climategate U-turn as scientist at centre of row admits: There has been no global warming since 1995

Professor Phil Jones of the Exxon funded UK Climatic Research Unit (CRU)skeptic think tank says that for the past 15 years there has been no ‘statistically significant’ warming.

http://www.dailymail.co.uk/news/article-1250872/Climategate-U-turn-Astonishment-scientist-centre-global-warming-email-row-admits-data-organised.html
Printer Friendly | Permalink |  | Top
 
GliderGuider Donating Member (1000+ posts) Send PM | Profile | Ignore Thu Nov-25-10 02:07 PM
Response to Reply #6
7. Do you have any clue what a 95% significance level is?
Here are a series of questions on this topic, asked by the BBC's environment analyst Roger Harrabin and answered by Professor Jones:

Q&A: Professor Phil Jones

B - Do you agree that from 1995 to the present there has been no statistically-significant global warming?
Yes, but only just. I also calculated the trend for the period 1995 to 2009. This trend (0.12C per decade) is positive, but not significant at the 95% significance level. The positive trend is quite close to the significance level. Achieving statistical significance in scientific terms is much more likely for longer periods, and much less likely for shorter periods.

C - Do you agree that from January 2002 to the present there has been statistically significant global cooling?
No. This period is even shorter than 1995-2009. The trend this time is negative (-0.12C per decade), but this trend is not statistically significant.

D - Do you agree that natural influences could have contributed significantly to the global warming observed from 1975-1998, and, if so, please could you specify each natural influence and express its radiative forcing over the period in Watts per square metre.
This area is slightly outside my area of expertise. When considering changes over this period we need to consider all possible factors (so human and natural influences as well as natural internal variability of the climate system). Natural influences (from volcanoes and the Sun) over this period could have contributed to the change over this period. Volcanic influences from the two large eruptions (El Chichon in 1982 and Pinatubo in 1991) would exert a negative influence. Solar influence was about flat over this period. Combining only these two natural influences, therefore, we might have expected some cooling over this period.

E - How confident are you that warming has taken place and that humans are mainly responsible?
I'm 100% confident that the climate has warmed. As to the second question, I would go along with IPCC Chapter 9 - there's evidence that most of the warming since the 1950s is due to human activity.

H - If you agree that there were similar periods of warming since 1850 to the current period, and that the MWP is under debate, what factors convince you that recent warming has been largely man-made?
The fact that we can't explain the warming from the 1950s by solar and volcanic forcing - see my answer to your question D.

I - Would it be reasonable looking at the same scientific evidence to take the view that recent warming is not predominantly manmade?
No - see again my answer to D.

Dr. Jones did NOT say there had been no warming since 1995. Dr. Jones was speaking as a scientist. You, on the other hand, are speaking through your hat.
Printer Friendly | Permalink |  | Top
 
Nihil Donating Member (1000+ posts) Send PM | Profile | Ignore Fri Nov-26-10 04:38 AM
Response to Reply #7
13. Bzzzt! Anatomy inversion detected!
> You, on the other hand, are speaking through your hat.

:hide:
Printer Friendly | Permalink |  | Top
 
guardian Donating Member (1000+ posts) Send PM | Profile | Ignore Sat Nov-27-10 02:42 AM
Response to Reply #7
15. "Dr. Jones did NOT say there had been no warming since 1995"
Edited on Sat Nov-27-10 02:56 AM by guardian
ummmm according to your own post

B - Do you agree that from 1995 to the present there has been no statistically-significant global warming?
Yes

C - Do you agree that from January 2002 to the present there has been statistically significant global cooling?
The trend this time is negative (-0.12C per decade)

You just confirmed my point: no statistically significant global warming. In fact, your supporting argument went further to cite Jones saying that we are currently experiencing a slight COOLING trend.
Printer Friendly | Permalink |  | Top
 
Viking12 Donating Member (1000+ posts) Send PM | Profile | Ignore Sat Nov-27-10 02:20 PM
Response to Reply #15
19. Do the math for 1995-present then get back to us, denier troll
Printer Friendly | Permalink |  | Top
 
guardian Donating Member (1000+ posts) Send PM | Profile | Ignore Sat Nov-27-10 10:34 PM
Response to Reply #19
21. Hey I'm just commenting on
what GliderGuider posted as a quote from Prof. Jones. If you don't like the comment about our being in a period of global cooling then take it up with GliderGuider or Prof. Jones.


But that would be logical.
Printer Friendly | Permalink |  | Top
 
GliderGuider Donating Member (1000+ posts) Send PM | Profile | Ignore Sat Nov-27-10 10:48 PM
Response to Reply #21
22. Your "comment" is incorrect.
That ice floe you denier trolls are standing on gets smaller every year.
Printer Friendly | Permalink |  | Top
 
pscot Donating Member (1000+ posts) Send PM | Profile | Ignore Wed Dec-01-10 04:31 PM
Response to Reply #22
28. Inhofe on an ice fflow
eyeball to eyeball with a polar bear momma.
Printer Friendly | Permalink |  | Top
 
Nederland Donating Member (1000+ posts) Send PM | Profile | Ignore Tue Nov-30-10 05:31 AM
Response to Reply #7
24. Yes, I know what a 95% significance level is
The question is, does the fact that the trend of 0.12C per decade since 1995 is half the trend predicted by computer models make you question their validity? If not, could you describe what type of future temperature data would lead you to say "hey, something is not right here...".
Printer Friendly | Permalink |  | Top
 
muriel_volestrangler Donating Member (1000+ posts) Send PM | Profile | Ignore Tue Nov-30-10 08:43 AM
Response to Reply #24
26. Looking at the GISS land-sea anomaly figures, I think the trend is 0.17C per decade
since the start of 1995. Is your 0.12C up to date - or from a couple of years ago?
Printer Friendly | Permalink |  | Top
 
Nederland Donating Member (1000+ posts) Send PM | Profile | Ignore Wed Dec-01-10 03:30 PM
Response to Reply #26
27. The 0.12C number comes from GliderGuider's post #7
The ultimate source is Jones himself. I imagine that actual number depends on what record you use, HadCrut, RSS, GISS, etc.
Printer Friendly | Permalink |  | Top
 
Viking12 Donating Member (1000+ posts) Send PM | Profile | Ignore Thu Dec-02-10 10:28 AM
Response to Reply #24
29. Nice strawman. Not surprising considering the source.
Tsk, tsk, tsk. Using the mean projection rather than the range in the projection envelopes is the kind of cherry-picking our denier friends would use. You do want to be taken seriously, don't you?.
Printer Friendly | Permalink |  | Top
 
guardian Donating Member (1000+ posts) Send PM | Profile | Ignore Thu Dec-02-10 10:49 AM
Response to Reply #29
30. "You do want to be taken seriously, don't you?"
Typical doomer arrogance. For someone to be "taken seriously" they must agree with you 100%. What condescending bullshit.
Printer Friendly | Permalink |  | Top
 
Viking12 Donating Member (1000+ posts) Send PM | Profile | Ignore Thu Dec-02-10 01:19 PM
Response to Reply #30
32. No, they just have to be honest and know what they're talking about. You do not qualify.
Printer Friendly | Permalink |  | Top
 
Nederland Donating Member (1000+ posts) Send PM | Profile | Ignore Thu Dec-02-10 12:24 PM
Response to Reply #29
31. Ok, so the answer to my first question is no
You don't believe that a trend of 0.12C per decade since 1995 is anything to worry about because we are still within the projection envelope. Fair enough. How about my second question? What type of future temperature data would lead you to question the validity of the models? From your post I'd assume that if temperature trends did slip below the projection range you would be concerned? Is that a fair statement, or have you basically drunk so deep of the catastrophic AGW kool-aid that no data will sway you from believing we are doomed?
Printer Friendly | Permalink |  | Top
 
XemaSab Donating Member (1000+ posts) Send PM | Profile | Ignore Sat Nov-27-10 05:38 PM
Response to Reply #6
20. .
Printer Friendly | Permalink |  | Top
 
DU AdBot (1000+ posts) Click to send private message to this author Click to view 
this author's profile Click to add 
this author to your buddy list Click to add 
this author to your Ignore list Tue May 07th 2024, 11:52 AM
Response to Original message
Advertisements [?]
 Top

Home » Discuss » Topic Forums » Environment/Energy Donate to DU

Powered by DCForum+ Version 1.1 Copyright 1997-2002 DCScripts.com
Software has been extensively modified by the DU administrators


Important Notices: By participating on this discussion board, visitors agree to abide by the rules outlined on our Rules page. Messages posted on the Democratic Underground Discussion Forums are the opinions of the individuals who post them, and do not necessarily represent the opinions of Democratic Underground, LLC.

Home  |  Discussion Forums  |  Journals |  Store  |  Donate

About DU  |  Contact Us  |  Privacy Policy

Got a message for Democratic Underground? Click here to send us a message.

© 2001 - 2011 Democratic Underground, LLC