 Average daily oil production, by month, from EIA and IEA, together with 13 month centered moving averages of each line, recursed once. Click to enlarge. Believed to be all liquids. Graph is not zero-scaled. Source: IEA Oil Market Reports, and EIA International Petroleum Monthly Table 1.4. The IEA line is taken from Table 3 of the tables section at the back of the OMR in the last issue for which the number for that month is given; last two points in purple are at earlier stages of revision than the rest of the graph.
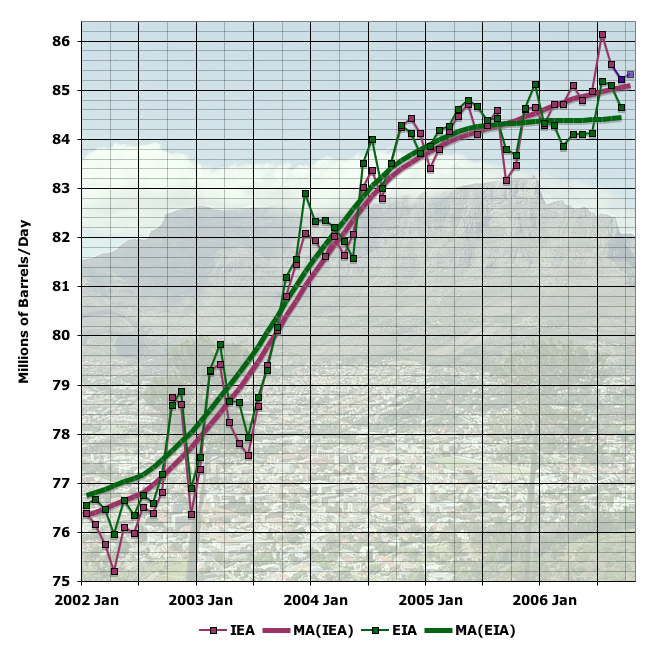
 Herewith a quick update on the supply situation. I briefly touched on recent declines in Saudi Arabian production the other day. The global supply situation is as above. Essentially, the situation has not qualitatively changed since I last discussed it. The two agencies I track (the US EIA and the OECD IEA) are at increasing variance about what's going on, with the EIA seeing supply basically flat over time, while the IEA sees a very slow rise in available supply (with data through October). For more background on this plateau debate, see this tutorial post. Presumably, this discrepancy will not continue too many more months, as it's going to get a little embarrassing.
At any rate, there's little doubt that the record month is now July 2006.
Expressed as growth rates, the difference between the two agencies is about half a percentage point. This next graph shows the year on year growth in the two moving average lines above (which themselves are thirteen month centered moving averages recursed once).
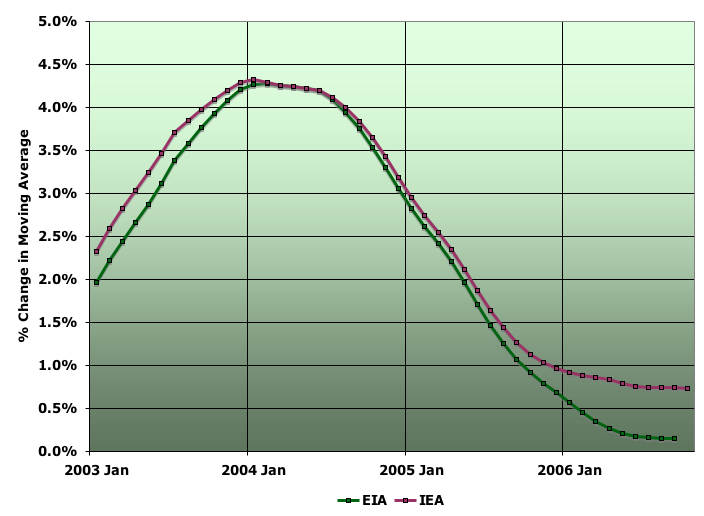 Year-on-year growth in moving averages of EIA and IEA oil production estimates. Click to enlarge. Believed to be all liquids. Source: IEA Oil Market Reports, and EIA International Petroleum Monthly Table 1.4. The IEA line is taken from Table 3 of the tables section at the back of the OMR in the last issue for which the number for that month is given.
 EDIT
Let me put up two other graphs of interest. The first is OPEC, which in November allegedly cut production. We'll have to await November/December statistics to see if that creates a noticeable step in the production history. However, here's the data available at present (which goes through September or October depending on source) and shows OPEC production already declining ahead of the planned cut).
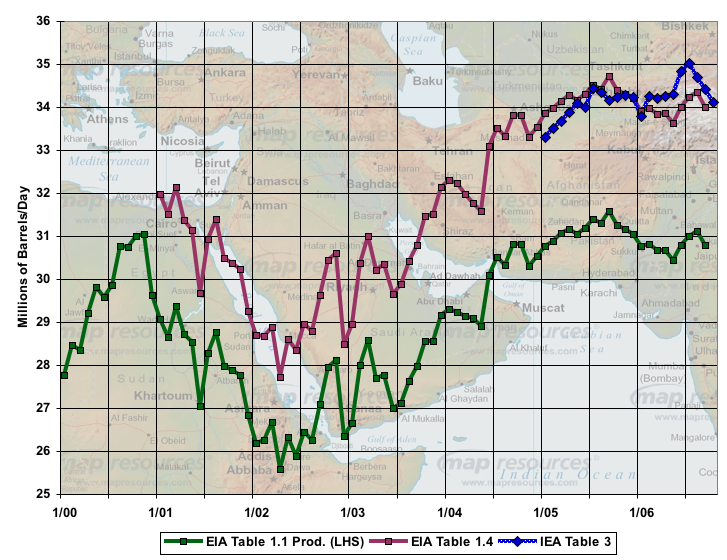 Estimates of OPEC production by EIA (both with (Table 1.4) and without (Table 1.1) NGLS) and IEA. Click to enlarge. Believed to be all liquids. Graph is not zero scaled. Click to enlarge. Source: IEA Oil Market Reports, and EIA International Petroleum Monthly Table 1.1 and 1.4. The IEA line is taken from Table 3 of the tables section at the back of the OMR in the last issue for which the number for that month is given.
Finally, during 2001-2004, when global production increased healthily, the bulk of that increase came from Saudi Arabia and Russia. With Saudi production declining, at least for the last year, Russia becomes of particular interest. Here's the latest picture:
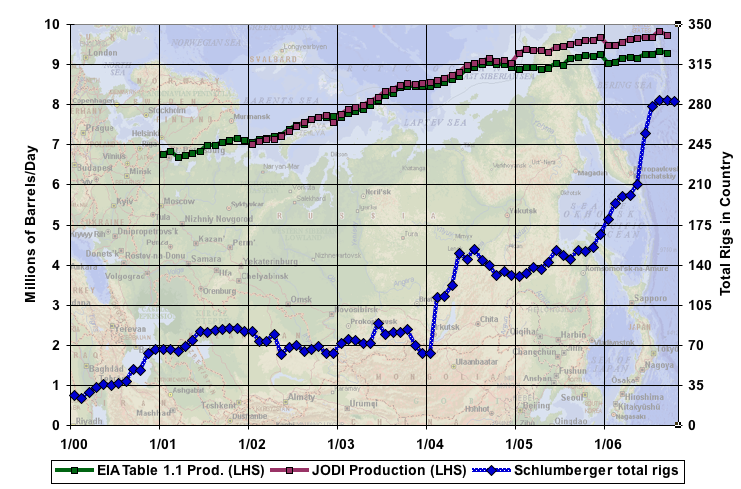 Estimates of Russian production by EIA and JODI (Joint Oil Data Initiative) on the left scale, and total drilling rigs in country on the right scale. Click to enlarge. Source: JODI, and EIA International Petroleum Monthly Table 1.1. Rig data is from Schlumberger, and includes rigs drilling for both oil and natural gas.
 As you can see, the Russian revival has not peaked out yet, though it has slowed to only around 1/2 mbpd in additional production each year over the last two years (about half the pace of production increases in the early part of the decade).
EDIT
http://www.theoildrum.com/story/2006/12/5/144125/842#more