Democratic Underground Latest Greatest Lobby Journals Search Options Help Login
Google

Statistical analysis of one legislative district in Washington state

Printer-friendly format Printer-friendly format
Printer-friendly format Email this thread to a friend
Printer-friendly format Bookmark this thread
This topic is archived.
Home » Discuss » Archives » General Discussion: Presidential (Through Nov 2009) Donate to DU
 
eridani Donating Member (1000+ posts) Send PM | Profile | Ignore Sun Mar-16-08 10:45 PM
Original message
Statistical analysis of one legislative district in Washington state
There is no registration by party, so we depend on canvassing and checking public donor records to assign voters statistical points indicating probable party. The numbers are the delegates from precinct caucuses. We have the legislative district caucuses on 4/5. I didn't include the 16 uncommitted in the totals.

Clinton
Democrats 155 54%
Independents 7 2%
Republicans 7 2%
Unknown 119 41%
Totals 288 100%

Obama
Democrats 255 41%
Independents 16 3%
Republicans 19 3%
Unknown 330 53%
Totals 620 100%

They aren't too different in drawing Republicans or Independents by percentage. The Repub caucuses were on the same day as ours, though. The Unknown category refers to people that we have not canvassed and have insufficient information about to determine party leanings. The larger percent of unknows for Obama indicates that he is bringing more new people in, but the differences in the percent unknowns isn't really large.
Printer Friendly | Permalink |  | Top
grantcart Donating Member (1000+ posts) Send PM | Profile | Ignore Sun Mar-16-08 10:46 PM
Response to Original message
1. Which district was this?
Printer Friendly | Permalink |  | Top
 
eridani Donating Member (1000+ posts) Send PM | Profile | Ignore Sun Mar-16-08 11:27 PM
Response to Reply #1
2. 11th LD
I got the data from VoteBuilder.
Printer Friendly | Permalink |  | Top
 
eridani Donating Member (1000+ posts) Send PM | Profile | Ignore Sun Mar-16-08 11:30 PM
Response to Original message
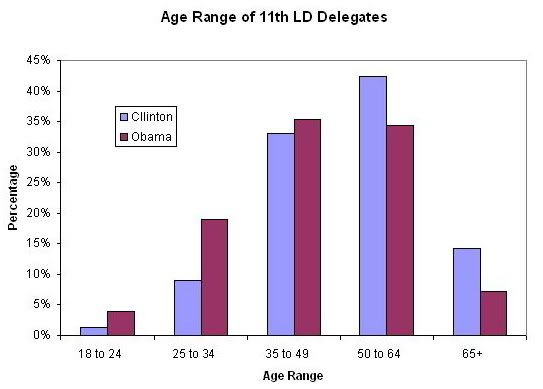
3. A chart showing the age range of the delegates and alternates


The 18-24 range didn't account for large percentages for either candidate.
Printer Friendly | Permalink |  | Top
 
eridani Donating Member (1000+ posts) Send PM | Profile | Ignore Tue Mar-18-08 08:53 AM
Response to Original message
4. This is really a change from 2004
I compiled the data from all precinct caucus goers for the 11th from 2004, and the change is astonishing.


Party Voters Percent
Democrat 735 94%
Independent  6 1%
Republican 1 0%
Unknown     38 5%
Printer Friendly | Permalink |  | Top
 
DU AdBot (1000+ posts) Click to send private message to this author Click to view 
this author's profile Click to add 
this author to your buddy list Click to add 
this author to your Ignore list Thu May 02nd 2024, 11:29 AM
Response to Original message
Advertisements [?]
 Top

Home » Discuss » Archives » General Discussion: Presidential (Through Nov 2009) Donate to DU

Powered by DCForum+ Version 1.1 Copyright 1997-2002 DCScripts.com
Software has been extensively modified by the DU administrators


Important Notices: By participating on this discussion board, visitors agree to abide by the rules outlined on our Rules page. Messages posted on the Democratic Underground Discussion Forums are the opinions of the individuals who post them, and do not necessarily represent the opinions of Democratic Underground, LLC.

Home  |  Discussion Forums  |  Journals |  Store  |  Donate

About DU  |  Contact Us  |  Privacy Policy

Got a message for Democratic Underground? Click here to send us a message.

© 2001 - 2011 Democratic Underground, LLC