General Discussion
Related: Editorials & Other Articles, Issue Forums, Alliance Forums, Region Forums = new reply since forum marked as read
Highlight:
NoneDon't highlight anything
5 newestHighlight 5 most recent replies
= new reply since forum marked as read
Highlight:
NoneDon't highlight anything
5 newestHighlight 5 most recent replies

uponit7771
(90,364 posts)
gratuitous
(82,849 posts)Cut Social Security and Medicare so those fatcat olds and sickos start paying their fair share to support corporate profits.

DownriverDem
(6,231 posts)Social Security has no affect on the deficit. Besides not all folks receiving Social Security are repubs.

volstork
(5,403 posts)n/t

True Dough
(17,327 posts)It's sickening what they're doing! Lining the pockets of the rich. So transparent, and yet blue-collar ReThug voters don't see it.

Haggis for Breakfast
(6,831 posts)volstork
(5,403 posts)n/t

GemDigger
(4,305 posts)Hortensis
(58,785 posts)
jalan48
(13,886 posts)
Oppaloopa
(867 posts)jalan48
(13,886 posts)
The Liberal Lion
(1,414 posts)The fruits of the productivity of America is going to fewer and fewer hands. But look who is being left holding the bad to pay off this simply unnecessary debt. This graph illustrates just what the common American has become: a slave.

forgotmylogin
(7,531 posts)But if TRMP were a shrewd politician, he'd use his bully pulpit to show this graph and call out corporations, saying "You got your tax relief, now start trickling it down, motherfuckers. Raise your minimum wage to a happy medium of $12 and show America that tax cuts do what we said they will."
That's the way he could spin this with minimum effort, and even if he was largely ignored, the optics would be undeniable.
But TRMP is not a shrewd politician.
DownriverDem
(6,231 posts)doesn't care. He's making money hand over fist. Why would he be against the tax cuts?
Oppaloopa
(867 posts)
Turin_C3PO
(14,063 posts)That graph needs to be distributed and shared all across the land.
Recommended.

Pendrench
(1,358 posts)
jayschool2013
(2,313 posts)
Oppaloopa
(867 posts)
Scurrilous
(38,687 posts)

BlueJac
(7,838 posts)
hostalover
(447 posts)
BigmanPigman
(51,630 posts)
SunSeeker
(51,715 posts)watoos
(7,142 posts)most of those Trump working class stiffs got more money because their employers deducted less taxes. Just wait until tax time when they don't get that big tax return they are used to getting.
BobTheSubgenius
(11,567 posts)The Zero, or starting point of reference is Q1 2017. Wages start there and stay flat, clearly. But why does the starting point of the measurement of corporate profits start at 2.5%? At that point, profits escalated literally instantaneously?
Perhaps there is an explanation for this that is completely eluding me, but graphs, in and of themselves,. are pretty simple. If there are convoluted aspects, it's in the methodology of gathering, calculation or interpretation.
Duppers
(28,127 posts)I haven't a clue however.

BumRushDaShow
(129,498 posts)So in the year from 1st qtr 2016 to 1st qtr 2017, the corporate profits had risen just over 2.5% from what they were, whereas wages had pretty much continued to stay stagnant during that 1 year period.
Fast forward to include what became large gains in the stock market and you find that corporate profits continued to increase (year over year) to eventually be 5% higher than the year before (i.e, compared to 4th qtr 2016).... AND with passage of the tax cuts for the wealthy, which included a hefty cut of the corporate taxes from 35% down to 21% (and all the corporate finagling to maximize their write-offs around that time), their profit soared compared to the same time in 2016 & eventually compared to 2017 (when you look at where they are today in 2018).
For some specifics - here was the stock market averages on 1/20/16 -
Dow: 15,766.7, -249.3 (-1.6%) S&P 500: 1,859.3, -22, (-1.2%) Nasdaq: 4,471.7, -5.3, (-0.1%) WTI Crude: $26.55, (-6%)
https://www.businessinsider.com/closing-bell-january-20-2016-1
And on 1/20/17 (inauguration day) -
Dow: 19,827.25, +94.85, (+0.48%) S&P 500: 2,271.31, +7.62, (+0.34%) Nasdaq: 5,555.33, +15.25, (+0.28%) US 10-year yield: 2.467%, +0.008 WTI Crude: $53.18, +1.06, (+2.03%)
https://markets.businessinsider.com/news/stocks/closing-bell-january-20-2017-2017-1-1001683234
And on 1/19/18 (1/20/18 was a Saturday this year) -
Dow: 26,115.65, -96.32 (-0.4%) S&P 500: 2,798.03 (-0.2%) Nasdaq: 7,296.05, -2.23 WTI Crude: $63.95, (-0.03%)
https://www.zacks.com/stock/news/289432/stock-market-news-for-jan-19-2018
Here is a bigger version of the graph -
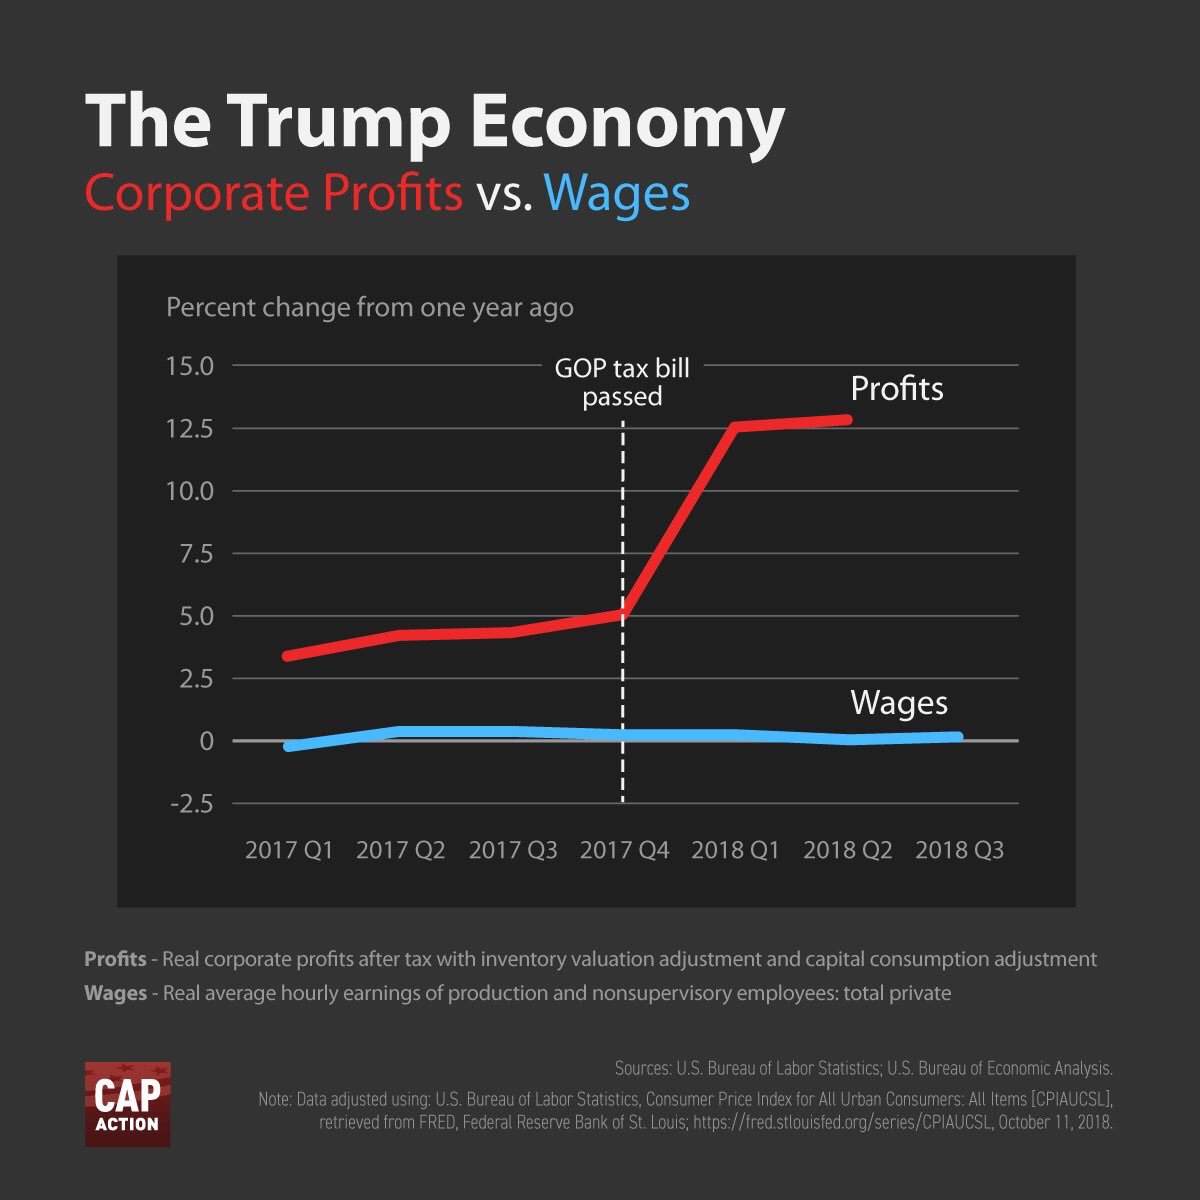
The chart uses BLS and Federal Reserve data.

calimary
(81,500 posts)
democratisphere
(17,235 posts)
garybeck
(9,942 posts)i am not going to share with with my friends unless i can provide a source.
zentrum
(9,865 posts)...on the chart. At least by my lights. Federal Bureau of Labor statistics. Etc.
Also note the CAP ACTION logo.
garybeck
(9,942 posts)i can't really read the sources, even with my glasses on
zentrum
(9,865 posts)...will go bankrupt.

malthaussen
(17,216 posts)... explains why they want another tax cut.
-- Mal

ProfessorGAC
(65,191 posts). . . just before the sudden jump and just after is pretty much the same.
So, the organic growth rate of profits appear to be about the same, and the entire delta is created by the firms paying less taxes and not passing any of that new net income onto the people that work there.
malthaussen
(17,216 posts)
jcgoldie
(11,646 posts)Hawley was 100% Trumper on everything including the tremendous wage increases that his policies on tax cuts and trade have supposedly created. McCaskill called him out on it saying twice that the tax cuts have not lead to wage increases as this diagram illustrates. Hawley was even reluctant to break with Trump on right to work, despite the fact that Missouri just overwhelmingly voted it down 70-30.
smirkymonkey
(63,221 posts)This will come in handy for the holiday tableside "chats" I am anticipating.