Middle-class income rose above $61,000 for the first time last year, U.S. Census Bureau say
Source: Washington Post
Business
Middle-class income rose above $61,000 for the first time last year, U.S. Census Bureau says
By Heather Long and Jeff Stein
September 12 at 10:27 AM
Middle-class income rose to the highest recorded levels in 2017 and the national poverty rate declined as the benefits of the strong economy lifted the fortunes of more Americans, the U.S. Census reported Wednesday.
The median U.S. household earned $61,372 last year, meaning half of the families in the country brought in more income than this and half earned less.
Crossing the $61,000 mark signals the American middle-class may have finally earned more than it did in 1999, although the Census Bureau cautions that median income last year was not statistically different from 1999 or 2007. A change in methodology in 2013 makes precise comparisons difficult. All the income figures have been adjusted for inflation and are reported in 2017 dollars.
Middle-class household income has been rising steadily in recent years as the economy has rebounded from the deep recession and millions of Americans have found jobs again. The extra pay from having another person in the home working again or working additional hours is the largest factor contributing to rising income.
....
Heather Long is an economics correspondent. Before joining The Washington Post, she was a senior economics reporter at CNN and a columnist and deputy editor at the Patriot-News in Harrisburg, Pa. She also worked at an investment firm in London. Follow https://twitter.com/byHeatherLong
Jeff Stein is a policy reporter on The Washington Post's Wonkblog team. Before joining The Post, Stein was a congressional reporter for Vox, where he wrote primarily about the Democratic Party and the left. In 2014, he founded the local news nonprofit the Ithaca Voice in Upstate New York. Follow https://twitter.com/jstein_wapo
Read more: https://www.washingtonpost.com/business/2018/09/12/middle-class-income-hit-an-all-time-high-last-year-us-census-says/
U.S.
Median Household Income Rose 1.8% in 2017, Census Bureau Figures Show
The nation's economic expansion is now in its 10th year; Data shows poverty rate inched lower
https://www.wsj.com/articles/median-household-income-rose-1-8-in-2017-census-bureau-figures-show-1536762535
By Janet Adamy
Updated Sept. 12, 2018 12:18 p.m. ET
U.S. household incomes rose for the third straight year in 2017, according to census figures released Wednesday that suggest more Americans are benefiting from the strong economy.
Median household income increased to $ 61,372 last year, up 1.8% when adjusted for inflation. There were 39.7 million people in poverty last year, and that rate inched down 0.4 percentage point. The percentage of people without health insurance coverage for the entire 2017 calendar year was 8.8%, or 28.5 million, not statistically different from 2016.
The household income level is the highest on record, but because of a change in the way the figures are calculated over time, census officials said the figure is essentially the same as previous income peaks in 1999 and 2007. The 2017 growth rate also lagged behind the previous two years, when median household income rose 3.2% in 2016 and 5.2% in 2015.
U.S. Incomes Hit Record High
The middle American household made $61,372 last year, according to census figures.
{The chart is interactive, and I can't copy the link.}
- - - - - - -
FOR IMMEDIATE RELEASE: WEDNESDAY, SEPTEMBER 12, 2018
Income, Poverty and Health Insurance Coverage in the United States: 2017
SEPTEMBER 12, 2018
RELEASE NUMBER CB18-144
https://www.census.gov/newsroom/press-releases/2018/income-poverty.html
SEPT. 12, 2018 -- The U.S. Census Bureau announced today that real median household income increased by 1.8 percent between 2016 and 2017, while the official poverty rate decreased 0.4 percentage points. At the same time, the number of people without health insurance coverage and the uninsured rate were not statistically different from 2016.
Median household income in the United States in 2017 was $61,372, an increase in real terms of 1.8 percent from the 2016 median income of $60,309. This is the third consecutive annual increase in median household income.
The nation's official poverty rate in 2017 was 12.3 percent, with 39.7 million people in poverty. The number of people in poverty in 2017 was not statistically different from the number in poverty in 2016. The 0.4 percentage-point decrease in the poverty rate from 2016 (12.7 percent) to 2017 represents the third consecutive annual decline in poverty. Since 2014, the poverty rate has fallen 2.5 percentage points, from 14.8 percent to 12.3 percent.
The percentage of people without health insurance coverage for the entire 2017 calendar year was 8.8 percent, or 28.5 million, not statistically different from 2016 (8.8 percent or 28.1 million people). Between 2016 and 2017, the number of people with health insurance coverage increased by 2.3 million, up to 294.6 million.
These findings are contained in two reports: Income and Poverty in the United States: 2017 and Health Insurance Coverage in the United States: 2017.
https://www.census.gov/content/census/en/library/publications/2018/demo/p60-263.html
https://www.census.gov/content/census/en/library/publications/2018/demo/p60-264.html
Another Census Bureau report, The Supplemental Poverty Measure: 2017, was also released today. The supplemental poverty rate in 2017 was 13.9 percent, not statistically different from the 2016 supplemental poverty rate of 14.0 percent. The Supplemental Poverty Measure (SPM) provides an alternative way of measuring poverty in the United States and serves as an additional indicator of economic well-being. The Census Bureau has published poverty estimates using the SPM annually since 2011 with the collaboration of the Bureau of Labor Statistics.
The Current Population Survey, sponsored jointly by the Census Bureau and Bureau of Labor Statistics, is conducted every month and is the primary source of labor force statistics for the U.S. population; it is used to calculate the monthly unemployment rate estimates. Supplements are added in most months; the Annual Social and Economic Supplement is designed to give annual, national estimates of income, poverty and health insurance numbers and rates. The most recent Annual Social and Economic Supplement was conducted nationwide (February, March and April 2018) and collected information about income and health insurance coverage during the 2017 calendar year.
The Current Population Survey-based income and poverty report includes comparisons with the previous year, and historical tables in the report contain statistics back to 1959. The health insurance report is based on both the Current Population Survey and the American Community Survey. State and local income, poverty and health insurance estimates will be released Thursday, Sept. 13, from the American Community Survey.
{snip}
- - - - - - -
Here's a chart:
Hat tip, Pacific Standard: MEDIAN HOUSEHOLD INCOME ROSE AGAIN IN 2017
 = new reply since forum marked as read
Highlight:
NoneDon't highlight anything
5 newestHighlight 5 most recent replies
= new reply since forum marked as read
Highlight:
NoneDon't highlight anything
5 newestHighlight 5 most recent replies

sandensea
(21,684 posts)Technology is a lot cheaper (and of course more abundant); but as far as most other expenses, we haven't budged in 40 years.
Except of course, those at the top.

mahatmakanejeeves
(57,664 posts)From the article:
Crossing the $61,000 mark signals the American middle-class may have finally earned more than it did in 1999, although the Census Bureau cautions that median income last year was not statistically different from 1999 or 2007. A change in methodology in 2013 makes precise comparisons difficult. All the income figures have been adjusted for inflation and are reported in 2017 dollars.
sandensea
(21,684 posts)Obviously someone making $61,000 in '78 was living very comfortably; today, as you know, a family of 3 (the average) can barely make it on that.
And yes, officially, real household incomes have stalled since '99 - but that's using the official CPI.
During the Bush years (after 2004), CPI was regularly and, sometimes, brazenly understated. Remember the almost invariable "3.3%" inflation - while gas, food, rent, health insurance, and education were going through the roof?
Pure fiction - like almost everything in the Dubya regime.
Taking those distortions into account, growth in real incomes is actually 10% lower at least.

Recursion
(56,582 posts)A middle class household in 1978 was making about $15,000, which translates to about $60,000 in modern dollars.
mahatmakanejeeves
(57,664 posts)Last edited Wed Sep 12, 2018, 03:27 PM - Edit history (1)
I added links to it and the health coverage report.
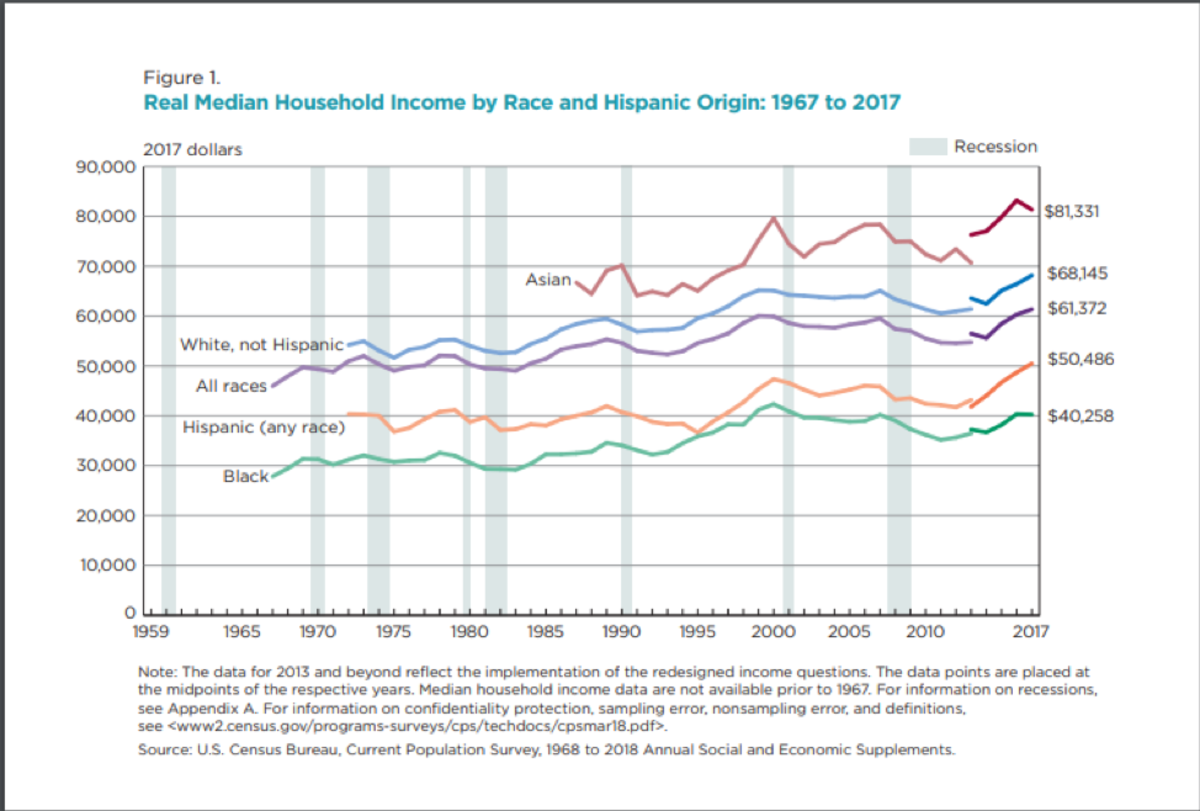
Here's one: https://www.census.gov/content/dam/Census/library/visualizations/2018/demo/p60-263/figure1.pdf
Best wishes.
ETA: someone turned the .pdf chart into a .png chart. Here it is.
Hat tip, Pacific Standard: MEDIAN HOUSEHOLD INCOME ROSE AGAIN IN 2017
sandensea
(21,684 posts)Economists consider the difference between $60,000 and $61,000 to be within the margin of error.
Recursion
(56,582 posts)One's mileage may vary, of course
sandensea
(21,684 posts)As economists always say: A billion here, a billion there, and pretty soon you're talking real money.
Recursion
(56,582 posts)sandensea
(21,684 posts)Recursion
(56,582 posts)Income is higher than it's ever been after you adjust for inflation. The median US household is able to buy more stuff now than at any point in the past.
sandensea
(21,684 posts)But, again, that's using official data - which during Bush's second term was being manhandled worse than Dirty Rice at the Mayflower Hotel.
Remember that? It was always "3.3%"
I mean, if the Midland Idiot meant it as a nod to his Masonic brethren, I'm sure they didn't appreciate it.
Recursion
(56,582 posts)People actually study this and know what they're doing. The way inflation is calculated has a lot of effort and intelligence behind it and isn't modified for political reasons.
mahatmakanejeeves
(57,664 posts)In the morning, they ride the Green Line to work. Whatever their political inclinations are outside work, they put those aside and deal with the numbers on a nonpolitical basis. At the end of the day, they get back on the Green Line and go home.
They don't have a dog in this fight, so to speak. They don't consider some numbers as "good" and other numbers as "bad." They're just numbers.
Finally, I am not being disparaging when I refer to them as bureaucrats.
Take budget deficits.
Everyone and their brother knew that Dubya's invasions would cost upwards of $100 billion a year (far from the quick, in-out he promised his flag-waving zombies in '03).
With Bush facing a tough re-election, no Republican wanted record deficits to hit headlines - thereby confirming eveything Gore had warned about in terms of deficits in 2000.
Rove's solution: put the wars off the books.
Doing so made every deficit figure from 2004 to 2008 around $175 billion less than it really was. And guess what?
The doctored figures still stand to. this. day.
Knowing that, well - touching up inflation data must have been a cinch.
Recursion
(56,582 posts)That's the point. Congress decides what is emergency spending and isn't. A professional statistician working in a basement on Independence Avenue calculates what the CPI is.
sandensea
(21,684 posts)Well.

True Dough
(17,337 posts)

JHan
(10,173 posts)raccoon
(31,127 posts)turbinetree
(24,726 posts)to really screw the middle class on home and state mortgages..................if your mortgage and your property tax is over $10,000 and lets say you pay $15,000, oh well, you get hit with the earned income tax and gotta pay for the $5,000, and those tax cuts......................so the haves have more than the have not's.......................austerity, is not good in three shell Paul "ayn rand Ryan, games.................CEO's are still making over 322% in income when compared to wages against the $61,000 figure...................
dchill
(38,559 posts)Recursion
(56,582 posts)There's no textbook reason 2016 should have been a change election, and no textbook reason that a sitting President should be this unpopular with this economy.

Chakaconcarne
(2,466 posts)I believe I heard they are recalculating what income is derived from to include benefits and pension whereas that has never been used before.

LisaM
(27,843 posts)Eight years ago I made less but could save (significantly) more, because my housing costs were under control. Then, the rent went up, house got sold by the landlord, had to move, found a way more expensive place at so-called market rate, and the rent goes up every effing year (and I can't afford to buy).
Recursion
(56,582 posts)A pretty significant one
Javaman
(62,534 posts)mahatmakanejeeves
(57,664 posts)Shawn M. Carter | @shawncarterm 8:45 AM ET Thu, 30 Aug 2018
Middle-class families are making less money in almost every U.S. state. Median incomes have dropped nationwide since 1999, in some places by nearly 9 percent. Still, according to a GOBankingRates study that identified "the best and worst states for the middle class," it's easier to get by in certain states than it is in others.
To be considered middle class, you have to earn an annual household income of "two-thirds to double the national median, after incomes have been adjusted for household size," according to Pew Research Center data. The most recent national household median income estimate was $59,039, the United States Census Bureau reports.
Based on GOBankingRates' study, which considers changes in income versus the costs of big-ticket items like housing and college tuition, here are the five best states in the US for the middle class:
{snip}
progree
(10,924 posts)Last edited Wed Sep 12, 2018, 07:12 PM - Edit history (2)
The stupid article itself
"The 5 best US states for the middle class" https://www.cnbc.com/2018/08/29/the-5-best-us-states-to-live-in-on-a-middle-class-income.html
doesn't say anything about being adjusted for inflation (shame shame on them, I hate that!!!!). I searched for "inflation" and "real". But the article they linked to does:
From that article:
The "making less money" link is to https://www.cnbc.com/2018/08/23/middle-class-incomes-have-shrunk-in-almost-every-state.html which has the "the incomes are adjusted for inflation" statement.
Nothing drives me more batty, and nothing drives me more insane, than articles and other written crap that doesn't make it clearly, perfectly clear whether the figures are or are not adjusted for inflation. Most of the time, when they don't, they are trying to fool people, the rest of the time, they are abysmally ignorant. This isn't directed at you, but at the horrible, terrible author of the article.
Recursion
(56,582 posts)Incomes have fallen slightly from 1999, which was an historic high point. They've risen from 1978 and 2008.
progree
(10,924 posts)adjusted for inflation, as I've seen many times here on DU.
When numbers are reported in the mainstream media or magazine articles, one can never assume which it is, depending on what numbers are being reported, in my experience. YMMV.
Edited to add: One example is BLS's Personal Income - the month over month figure, is the raw (not-inflation-adjusted number). Similarly when the monthly Payroll Jobs Report comes out, the reported increase in average hourly earnings is not inflation-adjusted. That's true even when comparing with the same month last year. Mainly because the monthly CPI report doesn't come out until later in the month. (Reporting and commentary on it MIGHT mention this and compare it to the latest available inflation number, however).
When the CPI does come out, the BLS then produces an inflation-adjusted version of the average hourly earnings, but it is barely noted in the media, certainly not with the prominence that the (not-inflation-adjusted) average hourly earnings gets when the payroll jobs report comes out.
I believe today's news from the Census Bureau is that inflation-adjusted (as well as nominal) median household income is at a new high, although ...
From OP:
Mad-in-Mo
(229 posts)haele
(12,682 posts)There's so many ways to identify someone as "Middle Class" - even if it's just by a particular area of measurement - by economists or sociologists, by the census, or historians...
For the sake of income - there's at least two official ways in the US that it can determined by income; one can measure "Middle Class" as the third quintile of taxpayers, or those whose income ranges from the median to 2/3 of the total estimated income in the U.S.
Still other groups identify Middle Class as people who are either professional or skilled labor (i.e. certified labor), or who make above the median income via investments or rents - or even separate out individuals from households in the situation where there are two wage earners. One rater for insurance identified me as "Middle Class" while my disabled spouse on SSDI was identified as "Dependent Poor", though we were in the same household.
While all of the three overlap, they're still more like a Venn diagram. Depending on who's doing the measuring, those people and/or households at the lower third of the income of any one of just those three groups probably won't be identified as "Middle Class" in any of the others.
Haele
mahatmakanejeeves
(57,664 posts)Or is that "1970s," with no apostrophe?
Analysis: "Not doing better than their fathers."
Men’s earnings have fallen since 1970?s, Census says.
Link to tweet
“Not doing better than their fathers:” Men’s earnings have fallen since 1970?s, Census says
By Jeff Stein
September 14 at 9:28 AM
The gender pay gap has begun narrowing over the last four decades -- and women’s earnings are now closer to men’s. But that is not only because women are doing better. ... The trend is also in part because men are earning less. Earnings for men have fallen in the decade since the recession, and are even below levels for much of the 1970?s and 1980?s.
Men are still paid about $10,000 more on average than women, according to Census Bureau figures released on Wednesday, but the gender earnings gap has grown smaller. ... From 1973 to 2017, men’s earnings fell by about $3,200, or about 5 percent, in numbers adjusted for inflation. Earnings for African-American men fell even more steeply than those of white men, according to experts.
“We’re talking about a 40-year period of people working full-time who are not doing better than their fathers and grandfathers did, and are basically doing worse,” said Mark Rank, an inequality expert at Washington University in St. Louis. “It’s a really striking pattern going on over a long period of time."
Census data show that average earnings for men fell again in 2017, the first year of the Trump administration. They fell for this same group in four of the eight years of the Obama administration as well: 2011, 2013, 2014, and 2016.
(The Washington Post)
....
eff Stein is a policy reporter on The Washington Post's Wonkblog team. Before joining The Post, Stein was a congressional reporter for Vox, where he wrote primarily about the Democratic Party and the left. In 2014, he founded the local news nonprofit the Ithaca Voice in Upstate New York. Follow https://twitter.com/jstein_wapo
mahatmakanejeeves
(57,664 posts)Hat tip, GreaterGreaterWashington:
LINKS By Liam Sullivan (Contributor) September 14, 2018
Household incomes in the District rise dramatically in 2017
By Tara Bahrampour
September 13 at 5:45 PM
Just a year after sluggish household income reports in the District prompted speculation that the city’s boom years were ending, new numbers from the Census Bureau released Thursday suggest D.C. household income has swung dramatically back up.
Median household income for the city in 2017 was $82,372, 9.1 percent higher than in 2016, according to new data from the bureau’s annual American Community Survey.
The rise reflects an increase nationwide: Median household income rose to the highest recorded levels last year, according to a separate set of census numbers released Wednesday.
[Middle-class incomes exceeded $61,000 for first time last year, Census Bureau says]
But the gain in the District was sharper. While the city’s median household income had been rising in previous years, it had decreased slightly in 2016, a change some experts attributed to a decline in high-paying government jobs and a tendency for young families to leave the city in search of more space and better schools.
....
....
Tara Bahrampour, a staff writer based in Washington, D.C., writes about aging, generations and demography. She has also covered immigration and education and has reported from the Middle East and North Africa, and from the republic of Georgia. Follow https://twitter.com/TaraBahrampour