Unemployment rate drops to 13 percent, as the economy began to lose jobs at a slower pace
Source: Washington Post
The federal unemployment rate declined to 13.3 percent in May from 14.7 percent in April, the Department of Labor said Friday, a sign that economy is recovering more quickly than economists had projected.
The economy gained 2.5 million jobs in May, as many states and counties began to reopen with the slowing of coronavirus cases nationwide.
These figures signal the U.S. economy is beginning to bottom out. Yet the 30 million workers who are still collecting unemployment benefits is a sign of how significantly the labor market has been upended.
“The idea you would see job gains and the unemployment rate falling was not something really that people were expecting,” said Jay Shambaugh, an economist at the Brookings Institution. “But a 13.3 percent unemployment rate is higher than any point in the Great Recession. It represents massive joblessness and economic pain. You need a lot of months of gains around this level to get back to the kind of jobs totals we used to have."
Read more: https://www.washingtonpost.com/business/2020/06/05/may-2020-jobs-report/
Original article (note the change from "lost their jobs" to "gained jobs" in the WaPo edit) -
Another 2.5 million workers lost their jobs in May from the economic havoc caused by the coronavirus, a staggering figure that could more than triple the total amount of jobs lost during the 2007 to 2009 recession.
There are hopes that May's unemployment rate is near the nadir of the crisis -- the rocky bottom below which the United States will sink no further. Yet, with some 30 million workers collecting unemployment benefits, the labor market has been upended.
Economists agree that getting back to normal will take longer and be more challenging than recessions of the past. The crisis has touched nearly every part of the economy.
 = new reply since forum marked as read
Highlight:
NoneDon't highlight anything
5 newestHighlight 5 most recent replies
= new reply since forum marked as read
Highlight:
NoneDon't highlight anything
5 newestHighlight 5 most recent replies

mahatmakanejeeves
(57,664 posts)Good morning, all.
Fri May 8, 2020: Links to earlier reports:
Friday, April 3, 2020: Links to earlier reports:
Wednesday, March 4, 2020: Links to earlier reports:
Friday, February 7, 2020: Links to earlier reports:
Thursday, January 9, 2020: Links to earlier reports:
Updated from this post of Friday, December 6, 2019: Good morning. Links to earlier reports:
-- -- -- -- -- --
[center]Past Performance is Not a Guarantee of Future Results.[/center]
Nonetheless, what is important is not this month's results, but the trend. Let’s look at some earlier numbers:
ADP® (Automatic Data Processing), for employment in May 2020:
Private-sector employment decreased by 2,760,000 from April to May, on a seasonally adjusted basis.
Bureau of Labor Statistics, for employment in April 2020:
Jobless rate soared to 14.7% in April as U.S. shed 20.5 million jobs amid coronavirus pandemic
ADP® (Automatic Data Processing), for employment in April 2020:
ADP National Employment Report: Private Sector Employment Decreased by 20,236,000 Jobs in April
Bureau of Labor Statistics, for employment in March 2020:
Nonfarm payroll employment falls by 701,000 in March; unemployment rate rises to 4.4%
ADP® (Automatic Data Processing), for employment in March 2020:
Private-sector employment decreased by 27,000 from February to March, on a seasonally adjusted basis
Bureau of Labor Statistics, for employment in February 2020:
The U.S. labor market showed strength in February, adding 273,000 jobs
ADP® (Automatic Data Processing), for employment in February 2020:
U.S. adds 183,000 private-sector jobs in February, ADP says
Bureau of Labor Statistics, for employment in January 2020:
The economy added 225,000 jobs in January, showing continued strength
ADP® (Automatic Data Processing), for employment in January 2020:
ADP says 291,000 private-sector jobs created in January, largest gain in 4 years
Bureau of Labor Statistics, for employment in December 2019:
Economy adds 145,000 jobs in December as unemployment rate remains at 3.5 percent
ADP® (Automatic Data Processing), for employment in December 2019:
U.S. private sector adds the most jobs in eight months
Bureau of Labor Statistics, for employment in November 2019:
Labor market remained strong in November as U.S. economy added 266,000 jobs
ADP® (Automatic Data Processing), for employment in November 2019:
U.S. private sector job growth slows down sharply in November: ADP
Bureau of Labor Statistics, for employment in October 2019:
U.S. economy added 128,000 jobs in October as GM strike displaced workers; jobless rate ticks up
Bureau of Labor Statistics, for employment in September 2019:
U.S. economy added just 136,000 jobs in September, in fresh sign economy is cooling
ADP® (Automatic Data Processing), for employment in September 2019:
ADP National Employment Report: Private Sector Employment Increased by 135,000 Jobs in September
Bureau of Labor Statistics, for employment in August 2019:
U.S. economy adds just 130,000 jobs in August amid worries
ADP® (Automatic Data Processing), for employment in August 2019:
Survey: Businesses added a solid 195,000 jobs in August
Bureau of Labor Statistics, for employment in July 2019:
U.S. Added 164,000 Jobs in July; Unemployment Rate at 3.7 Percent
ADP® (Automatic Data Processing), for employment in July 2019:
ADP says 156,000 private-sector jobs added created in July
Bureau of Labor Statistics, for employment in June 2019:
Hiring rebounds as U.S. economy adds 224,000 jobs in June;unemployment rate inched up to 3.7 percent
ADP® (Automatic Data Processing), for employment in June 2019:
U.S. private sector hiring picks up less than expected in June: ADP
Bureau of Labor Statistics, for employment in May 2019:
The U.S. economy added only 75,000 jobs in May amid bite from Trump's trade war
ADP® (Automatic Data Processing), for employment in May 2019:
ADP private-sector job growth tumbles to a 9-year low in May

BumRushDaShow
(129,662 posts)because I think the media is in disbelief. I had to keep refreshing front pages to see if anyone had it. Most likely much head-scratching going on. 
Edit - AND just getting a breaking from WaPo.

appalachiablue
(41,182 posts)As Hiring Rebounded'...
Huh?
https://www.msn.com/en-us/money/markets/us-jobless-rate-unexpectedly-fell-in-may-as-hiring-rebounded/ar-BB154ATi
BumRushDaShow
(129,662 posts)
No agency untouched. Hopefully the analysts will delve into the data and see what the heck has changes with their "household surveys".

PatrickforO
(14,594 posts)if anything had changed about the way they are reporting the data. She said, "No, the data is what it is."
If that is the case, then we're not out of the woods yet, but this is positive.
HOWEVER, based on the fact that the Trump administration ordered states in March to drag their feet on reporting mass layoffs, I can't help but have a nagging suspicion here. I don't want to think that somebody there is cooking the books to make things look better than they are for political reasons, because I'm an economist and we live and breathe by this, and other data.
But the truth is we are only as good as our data, and I've noticed that they have just today posted the LAUS numbers at county level, even though my state's labor market information division had published them several weeks ago.
What are your thoughts?

tblue37
(65,502 posts)
Bengus81
(6,936 posts)mahatmakanejeeves
(57,664 posts)BLS page says employment went up, not unemployment.
denem
(11,045 posts)Bengus81
(6,936 posts)Last edited Sat Jun 6, 2020, 11:02 AM - Edit history (1)
Than in 2010 when Obama was slowly pulling us out of the Bush recession? Business were open, never had closed--and fully open. There weren't reports of people not being able to get unemployment because of an overwhelmed system. And yet that rate was 10%. So with all this news,all the closings for months the unemployment is only 3.7% higher? Total BS and not surprised from this administration.
Hell even in Republican run Kansas we are STILL not 100% open and won't be to almost the end of June and only IF numbers are met.
tblue37
(65,502 posts)
IthinkThereforeIAM
(3,077 posts)... just my two cents. I would toss in two dollars but...

Happy Hoosier
(7,425 posts)I’m not usually a “they’re juicing the numbers” guy, but I find this really, REALLY hard believe.
samsingh
(17,602 posts)shockey80
(4,379 posts)mahatmakanejeeves
(57,664 posts)Nonfarm payroll employment rises by 2.5 million in May; unemployment rate falls to 13.3%
https://www.bls.gov/
progree
(10,924 posts)that added "almost 5%" to the official 14.7% number.
https://www.democraticunderground.com/?com=edit&forum=1014&thread=2507000&pid=2507049
Maybe lots of people just gave up looking for work. (You aren't counted as unemployed unless you have actively sought work in the last 4 weeks).
turbinetree
(24,726 posts)new claims climbed to 1.8 million yesterday and that works out to 42 million without jobs.................Bullshit
JC Penny is closing its stores for example, Macy's, Nordstroms, .............Boeing is laying off, .................Bullshit

durablend
(7,465 posts)No doubt so they can throw water on any more stimulus.

FBaggins
(26,775 posts)This may be the first result of the change to not releasing to the media early and embargoing the data (so that they have time to write their stories). Reporting now is that there was an increase of 2.5 million jobs.
Stunning.
mahatmakanejeeves
(57,664 posts)FBaggins
(26,775 posts)"In the LAST SEVEN DAYS did you have a job either full or part time? Include any job from which you were temporarily absent"
There may be millions of people who went and filed for unemployment benefits expecting to be away from work for a few weeks... but who nevertheless consider themselves employed and temporarily absent.
Steelrolled
(2,022 posts)I really wonder why newspapers would risk looking incompetent, just to get the story out a few hours early. And why, after the economists completely got it wrong, they continue to quote them in the update. The success rate for economists predicting the future is well known.
still_one
(92,454 posts)see consumer running out and buying non-essentials
mathematic
(1,440 posts)Employed people is roughly 20 million less than it was last year. Peak continuing claims was about 4 million more than the mid-may decline in continuing claims.
They're different calculations measuring different things but they're basically in agreement.
still_one
(92,454 posts)mathematic
(1,440 posts)The economy came off lockdown in may. Right now, that seems to be the mechanism for the payroll increase. I haven't had a chance to look too deeply into the report.
I did speculate last month that the may report wouldn't be as bad as the worst week due to people going back to work (though admittedly I didn't expect a gain):
https://www.democraticunderground.com/?com=view_post&forum=1014&pid=2489502
We'll probably never see the peak unemployment number in a jobs report
Construction and manufacturing are getting back to work in most places in time for May's survey. Peak unemployment was probably the last week of April or maybe the first week of May.
still_one
(92,454 posts)much, even with parts of the economy opening up, doesn't add up
I don't think what has happened to a lot of businesses which haven't opened up are represented in these numbers.
Would the PPP loans kicking in so business have to maintain payroll to qualify for forgiveness account for this much increase?
FBaggins
(26,775 posts)and a number derived from a survey.
A survey that wasn't designed to accommodate a pandemic shutdown where people "lost jobs" that they expected to return to a month later.
The question to ponder is how many people applied for "unemployment benefits" but don't consider themselves unemployed... and does the BLS survey accurately evaluate those considerations.
As I posted above... one key question is:
"In the LAST SEVEN DAYS did you have a job either full or part time? Include any job from which you were temporarily absent"
still_one
(92,454 posts)businesses are keeping payrolls going for those sitting at home, so they don't have to pay those loans back, with the intent to hire those on layoff also?
FBaggins
(26,775 posts)But there would have to be a bunch who had been formerly laid off in order to jibe with the new unemployment figures over the last several weeks.
mahatmakanejeeves
(57,664 posts)Employment Situation Summary
Transmission of material in this news release is embargoed until 8:30 a.m. (EDT) Friday, June 5, 2020
Technical information:
Household data: cpsinfo@bls.gov * www.bls.gov/cps
Establishment data: cesinfo@bls.gov * www.bls.gov/ces
Media contact: (202) 691-5902 * PressOffice@bls.gov
THE EMPLOYMENT SITUATION -- MAY 2020
Total nonfarm payroll employment rose by 2.5 million in May, and the unemployment rate declined to 13.3 percent, the U.S. Bureau of Labor Statistics reported today. These improvements in the labor market reflected a limited resumption of economic activity that had been curtailed in March and April due to the coronavirus (COVID-19) pandemic and efforts to contain it. In May, employment rose sharply in leisure and hospitality, construction, education and health services, and retail trade. By contrast, employment in government continued to decline sharply.
This news release presents statistics from two monthly surveys. The household survey measures labor force status, including unemployment, by demographic characteristics. The establishment survey measures nonfarm employment, hours, and earnings by industry. For more information about the concepts and statistical methodology used in these two surveys, see the Technical Note.
Household Survey Data
The unemployment rate declined by 1.4 percentage points to 13.3 percent in May, and the number of unemployed persons fell by 2.1 million to 21.0 million. Reflecting the effects of the coronavirus pandemic and efforts to contain it, the unemployment rate and the number of unemployed persons are up by 9.8 percentage points and 15.2 million, respectively, since February. (See table A-1. For more information about how the household survey and its measures were affected by the coronavirus pandemic, see the box note at the end of the news release.)
Among the major worker groups, the unemployment rates declined in May for adult men (11.6 percent), adult women (13.9 percent), Whites (12.4 percent), and Hispanics (17.6 percent). The jobless rates for teenagers (29.9 percent), Blacks (16.8 percent), and Asians (15.0 percent) showed little change over the month. (See tables A-1, A-2, and A-3.)
The number of unemployed persons who were on temporary layoff decreased by 2.7 million in May to 15.3 million, following a sharp increase of 16.2 million in April. Among those not on temporary layoff, the number of permanent job losers continued to rise, increasing by 295,000 in May to 2.3 million. (See table A-11.)
In May, the number of unemployed persons who were jobless less than 5 weeks decreased by 10.4 million to 3.9 million. These individuals made up 18.5 percent of the unemployed. The number of unemployed persons who were jobless 5 to 14 weeks rose by 7.8 million to 14.8 million, accounting for about 70.8 percent of the unemployed. The number of long-term unemployed (those jobless for 27 weeks or more), at 1.2 million, increased by 225,000 over the month and represented 5.6 percent of the unemployed. (See table A-12.)
The labor force participation rate increased by 0.6 percentage point in May to 60.8 percent, following a decrease of 2.5 percentage points in April. Total employment, as measured by the household survey, rose by 3.8 million in May to 137.2 million, following a large decline in April. After an 8.7 percentage-point decline in April, the employment-population ratio rose by 1.5 percentage points to 52.8 percent in May. (See table A-1.)
In May, the number of persons who usually work full time increased by 2.2 million to 116.5 million, and the number who usually work part time rose by 1.6 million to 20.7 million. Part-time workers accounted for about two-fifths of the over-the-month employment growth. (See table A-9.)
The number of persons employed part time for economic reasons, at 10.6 million, changed little in May, but is up by 6.3 million since February. These individuals, who would have preferred full-time employment, were working part time because their hours had been reduced or they were unable to find full-time jobs. This group includes persons who usually work full time and persons who usually work part time. (See table A-8.)
The number of persons not in the labor force who currently want a job, at 9.0 million, declined by 954,000 in May, after increasing by 4.4 million in April. These individuals were not counted as unemployed because they were not actively looking for work during the last 4 weeks or were unavailable to take a job. (See table A-1.)
Persons marginally attached to the labor force--a subset of persons not in the labor force who currently want a job--numbered 2.4 million in May, little different from the prior month. These individuals were not in the labor force, wanted and were available for work, and had looked for a job sometime in the prior 12 months but had not looked for work in the 4 weeks preceding the survey. Discouraged workers, a subset of the marginally attached who believed that no jobs were available for them, numbered 662,000 in May, also little changed from the previous month. (See Summary table A.)
Establishment Survey Data
Total nonfarm payroll employment increased by 2.5 million in May, reflecting a limited resumption of economic activity that had been curtailed due to the coronavirus pandemic and efforts to contain it. Employment fell by 1.4 million and 20.7 million, respectively, in March and April. Despite the over-the-month increase, nonfarm employment in May was 13 percent below its February level. Large employment increases occurred in May in leisure and hospitality, construction, education and health services, and retail trade. Government employment continued to decline sharply. (See table B-1. For more information about how the establishment survey and its measures were affected by the coronavirus pandemic, see the box note at the end of the news release.)
In May, employment in leisure and hospitality increased by 1.2 million, following losses of 7.5 million in April and 743,000 in March. Over the month, employment in food services and drinking places rose by 1.4 million, accounting for about half of the gain in total nonfarm employment. May's gain in food services and drinking places followed steep declines in April and March (-6.1 million combined). In contrast, employment in the accommodation industry fell in May (-148,000) and has declined by 1.1 million since February.
Construction employment increased by 464,000 in May, gaining back almost half of April's decline (-995,000). Much of the gain occurred in specialty trade contractors (+325,000), with growth about equally split between the residential and nonresidential components. Job gains also occurred in construction of buildings (+105,000), largely in residential building.
Employment increased by 424,000 in education and health services in May, after a decrease of 2.6 million in April. Health care employment increased by 312,000 over the month, with gains in offices of dentists (+245,000), offices of other health practitioners (+73,000), and offices of physicians (+51,000). Elsewhere in health care, job losses continued in nursing and residential care facilities (-37,000) and hospitals (-27,000). Employment increased in the social assistance industry (+78,000), reflecting increases in child day care services (+44,000) and individual and family services (+29,000). Employment in private education rose by 33,000 over the month.
In May, employment in retail trade rose by 368,000, after a loss of 2.3 million in April. Over-the-month job gains occurred in clothing and clothing accessories stores (+95,000), automobile dealers (+85,000), and general merchandise stores (+84,000). By contrast, job losses continued in electronics and appliance stores (-95,000) and in auto parts, accessories, and tire stores (-36,000).
Employment increased in the other services industry in May (+272,000), following a decline of 1.3 million in April. About two-thirds of the May increase occurred in personal and laundry services (+182,000).
In May, manufacturing employment rose by 225,000, with gains about evenly split between the durable and nondurable goods components. In April, manufacturing employment declined by 1.3 million, with about two-thirds of the loss occurring in the durable goods component. Within durable goods, employment gains in May were led by motor vehicles and parts (+28,000), fabricated metal products (+25,000), and machinery (+23,000). Within nondurable goods, job gains occurred in plastics and rubber products (+30,000) and food manufacturing (+25,000).
Professional and business services added 127,000 jobs in May, after shedding 2.2 million jobs in April. Over the month, employment rose in services to buildings and dwellings (+68,000) and temporary help services (+39,000), while employment declined in management of companies and enterprises (-22,000).
Financial activities added 33,000 jobs over the month, following a loss of 264,000 jobs in April. In May, employment gains occurred in real estate and rental and leasing (+24,000) and in credit intermediation and related activities (+7,000).
Wholesale trade employment was up by 21,000 in May, largely reflecting job gains in its nondurable goods component (+13,000). In April, wholesale trade employment declined by 383,000.
In May, employment continued to decline in government (-585,000), following a drop of 963,000 in April. Employment in local government was down by 487,000 in May. Local government education accounted for almost two-thirds of the decrease (-310,000), reflecting school closures. Employment also continued to decline in state government (-84,000), particularly in state education (-63,000).
Employment in information fell by 38,000 in May, following a decline of 272,000 in April.
Mining continued to lose jobs in May (-20,000), with most of the decline occurring in support activities for mining (-16,000). Mining employment has declined by 77,000 over the past 3 months.
Employment in transportation and warehousing decreased in May (-19,000), after an April decline of 553,000. Air transportation lost 50,000 jobs over the month, following a loss of 79,000 jobs in April. In May, employment rose by 12,000 in couriers and messengers and 10,000 in transit and ground passenger transportation.
In May, average hourly earnings for all employees on private nonfarm payrolls fell by 29 cents to $29.75, following a gain of $1.35 in April. Average hourly earnings of private-sector production and nonsupervisory employees decreased by 14 cents to $25.00 in May. The decreases in average hourly earnings largely reflect job gains among lower-paid workers; this change put downward pressure on the average hourly earnings estimates. (See tables B-3 and B-8.)
The average workweek for all employees on private nonfarm payrolls increased by 0.5 hour to 34.7 hours in May. In manufacturing, the workweek rose by 0.8 hour to 38.9 hours, and overtime increased by 0.3 hour to 2.4 hours. The average workweek for production and nonsupervisory employees on private nonfarm payrolls increased by 0.6 hour to 34.1 hours. While employees in most industries saw an increase in their workweeks in May, the employment changes, especially in industries with shorter workweeks, complicate monthly comparisons of the average weekly hours estimates. (See tables B-2 and B-7.)
The change in total nonfarm payroll employment for March was revised down by 492,000, from -881,000 to -1.4 million, and the change for April was revised down by 150,000, from -20.5 million to -20.7 million. With these revisions, employment in March and April combined was 642,000 lower than previously reported. (Monthly revisions result from additional reports received from businesses and government agencies since the last published estimates and from the recalculation of seasonal factors. A methodological change to the establishment survey's birth-death model contributed to the revision for March. For more information, see the box note at the end of the news release.) After revisions, job losses have averaged 6.5 million per month over the past 3 months.
_____________
The Employment Situation for June is scheduled to be released on Thursday, July 2, 2020, at 8:30 a.m. (EDT).
_____________________________________________________________________
|
|
| Coronavirus (COVID-19) Impact on May 2020 Establishment and Household Survey Data
|
|
| Data collection for both surveys was affected by the coronavirus (COVID-19) pandemic.
| In the establishment survey, approximately one-fifth of the data is collected at four
| regional data collection centers. Although these centers were closed, about three-
| quarters of the interviewers at these centers worked remotely to collect data by
| telephone. Additionally, BLS encouraged businesses to report electronically. The
| collection rate for the establishment survey in May was 69 percent, slightly lower
| than collection rates prior to the pandemic. The household survey is generally
| collected through in-person and telephone interviews, but personal interviews were
| not conducted for the safety of interviewers and respondents. The household survey
| response rate, at 67 percent, was about 15 percentage points lower than in months
| prior to the pandemic.
|
| In the establishment survey, workers who are paid by their employer for all or any
| part of the pay period including the 12th of the month are counted as employed, even
| if they were not actually at their jobs. Workers who are temporarily or permanently
| absent from their jobs and are not being paid are not counted as employed, even if
| they are continuing to receive benefits.
|
| The estimation methods used in the establishment survey were the same for May as they
| were for April. However, after further research, BLS extended the modifications that
| were made to the April birth-death model back to March, which accounted for a portion
| of the revision to March data. For more information, see
| www.bls.gov/cps/employment-situation-covid19-faq-may-2020.pdf.
|
| In the household survey, individuals are classified as employed, unemployed, or not
| in the labor force based on their answers to a series of questions about their
| activities during the survey reference week (May 10th through May 16th). Workers who
| indicate they were not working during the entire survey reference week and expect to
| be recalled to their jobs should be classified as unemployed on temporary layoff. In
| May, a large number of persons were classified as unemployed on temporary layoff.
|
| However, there was also a large number of workers who were classified as employed but
| absent from work. As was the case in March and April, household survey interviewers
| were instructed to classify employed persons absent from work due to coronavirus-
| related business closures as unemployed on temporary layoff. However, it is apparent
| that not all such workers were so classified. BLS and the Census Bureau are
| investigating why this misclassification error continues to occur and are taking
| additional steps to address the issue.
|
| If the workers who were recorded as employed but absent from work due to "other
| reasons" (over and above the number absent for other reasons in a typical May) had
| been classified as unemployed on temporary layoff, the overall unemployment rate
| would have been about 3 percentage points higher than reported (on a not seasonally
| adjusted basis). However, according to usual practice, the data from the household
| survey are accepted as recorded. To maintain data integrity, no ad hoc actions are
| taken to reclassify survey responses.
|
| More information is available at
| www.bls.gov/cps/employment-situation-covid19-faq-may-2020.pdf.
|
|_____________________________________________________________________
Employment Situation Summary Table A. Household data, seasonally adjusted
Employment Situation Summary Table B. Establishment data, seasonally adjusted
Employment Situation Frequently Asked Questions
Employment Situation Technical Note
Table A-1. Employment status of the civilian population by sex and age
Table A-2. Employment status of the civilian population by race, sex, and age
Table A-3. Employment status of the Hispanic or Latino population by sex and age
Table A-4. Employment status of the civilian population 25 years and over by educational attainment
Table A-5. Employment status of the civilian population 18 years and over by veteran status, period of service, and sex, not seasonally adjusted
Table A-6. Employment status of the civilian population by sex, age, and disability status, not seasonally adjusted
Table A-7. Employment status of the civilian population by nativity and sex, not seasonally adjusted
Table A-8. Employed persons by class of worker and part-time status
Table A-9. Selected employment indicators
Table A-10. Selected unemployment indicators, seasonally adjusted
Table A-11. Unemployed persons by reason for unemployment
Table A-12. Unemployed persons by duration of unemployment
Table A-13. Employed and unemployed persons by occupation, not seasonally adjusted
Table A-14. Unemployed persons by industry and class of worker, not seasonally adjusted
Table A-15. Alternative measures of labor underutilization
Table A-16. Persons not in the labor force and multiple jobholders by sex, not seasonally adjusted
Table B-1. Employees on nonfarm payrolls by industry sector and selected industry detail
Table B-2. Average weekly hours and overtime of all employees on private nonfarm payrolls by industry sector, seasonally adjusted
Table B-3. Average hourly and weekly earnings of all employees on private nonfarm payrolls by industry sector, seasonally adjusted
Table B-4. Indexes of aggregate weekly hours and payrolls for all employees on private nonfarm payrolls by industry sector, seasonally adjusted
Table B-5. Employment of women on nonfarm payrolls by industry sector, seasonally adjusted
Table B-6. Employment of production and nonsupervisory employees on private nonfarm payrolls by industry sector, seasonally adjusted(1)
Table B-7. Average weekly hours and overtime of production and nonsupervisory employees on private nonfarm payrolls by industry sector, seasonally adjusted(1)
Table B-8. Average hourly and weekly earnings of production and nonsupervisory employees on private nonfarm payrolls by industry sector, seasonally adjusted(1)
Table B-9. Indexes of aggregate weekly hours and payrolls for production and nonsupervisory employees on private nonfarm payrolls by industry sector, seasonally adjusted(1)
Access to historical data for the "A" tables of the Employment Situation News Release
Access to historical data for the "B" tables of the Employment Situation News Release
HTML version of the entire news release
* * * * *
[center]Facilities for Sensory Impaired[/center]
Information from these releases will be made available to sensory impaired individuals upon request. Voice phone: 202-691-5200, Federal Relay Services: 1-800-877-8339.
BumRushDaShow
(129,662 posts)that would mean a HUGE level of hiring to offset the massive furloughs and layoffs during that month that were literally in the millions per week... Unless they don't count "furloughs" (regardless of those people collecting UE from their states) as being "unemployed". 
mahatmakanejeeves
(57,664 posts)BumRushDaShow
(129,662 posts)(today - a Full Moon day - should be interesting to say the least
 )
)
ETA - I did just update the WaPo "edited" content in the OP.

still_one
(92,454 posts)mahatmakanejeeves
(57,664 posts)I link to the BLS month after month after month after....
I also keep a running timeline that stretches back over the years so that people can watch the trend.
DU has always been a straight arrow on the BLS employment payroll reports. They show up here within minutes of their release, regardless of what the numbers say.
Thanks for the thanks. Keep up the good work.
still_one
(92,454 posts)
ariadne0614
(1,737 posts)I don’t trust any “information” oozing up from the fetid swamp of the orange monster’s fever dreams. His disease has infected every institution, and the reThugs need an excuse to keep sitting on their hands. This report is a little too convenient, imho.
still_one
(92,454 posts)claims for unemployment

bucolic_frolic
(43,364 posts)Anything he doesn't like, he doesn't see it. His minions have their instructions to fudge statistics. And they all report to Barr.
mahatmakanejeeves
(57,664 posts)Unemployment Rate Fell to 13.3% in May
The U.S. jobless rate fell to 13.3% in May and payrolls rose by 2.5 million, as signs suggest jobs are returning. The unemployment rate was 3.5% in February and surged in April to 14.7%, the highest level for records dating from 1948. Census Bureau research shows the jobless rate peaked in the 20th century at about 25% in 1933.
Stock Futures Surge on Surprisingly Strong Jobs Report
Investors Climb Back Into Riskiest Emerging-Market Bonds
denem
(11,045 posts)bucolic_frolic
(43,364 posts)
maxrandb
(15,364 posts)Call it an "asterisk".
There's a footnote that apparently cooks into the numbers a 3% Covid 19 anomaly.
That 3% Covid 19 factor would appear to make the UE rate 16.3, not 13.3
Steelrolled
(2,022 posts)This whole thing is about Covid 19.

ProfessorGAC
(65,248 posts)They redact what statisticians call special causes. They did it after Northridge, after Andrew & Katrina, etc.
The stated purpose is to make trending as a sign of economic well being comparable over years.
The "asterisk" wasn't dug up. The redaction is noted on page one, including the number and the reason.
It's not new, it's not unusual, and there's no obfuscation.

honest.abe
(8,685 posts)There is no reason to expect these people to be rehired... in fact there is good reason to think they will not be.
ProfessorGAC
(65,248 posts)Especially in food service!
But, I think "unlike no other" is an overstatement.
A special cause is a special cause.
They did not do anything differently in this case. They did the same thing they've done since the early 70s.
And, they are still doing it openly and well noted. There's no chicanery going on.
honest.abe
(8,685 posts)ProfessorGAC
(65,248 posts)Apples & oranges.
honest.abe
(8,685 posts)
progree
(10,924 posts)The Washington Post article says that despite efforts to correct the problem (good article on the problem, BTW), "there are lots of field staff who had a tried and true way of asking questions and they were doing what they were used to doing.”
https://www.washingtonpost.com/business/2020/06/05/may-2020-jobs-report-misclassification-error
(I think we've all had coworkers like that. Still, I'm disappointed that after 3 months they still can't get a handle on it -- they made the same kind of error in March and April -- April's error was even larger, "almost 5 percentage points". ## The Washington Post link is the same one as #74)
... One of the first questions that gets asked is did the person do any work “for pay or profit?” There are then 45 pages of follow up questions that come after that. One of those questions asks if someone was “temporarily absent” from the job and why that absence occurred. One of the responses is “other.”
The BLS instructed surveyors to try to figure out if someone was absent because of the pandemic and, if so, to classify them as on “temporary layoff,” meaning they would count in the unemployment data. But some people continued to insist they were just “absent” from work during the pandemic, and the BLS has a policy of not changing people’s answers once they are recorded. It’s how the BLS protects again bias or data manipulation.
... “It’s surprising the BLS couldn’t come up with fixes to make this work in May,” said Erica Groshen, the former BLS commissioner under Obama. But, she adds, “This is a very unusual situation. There are lots of field staff who had a tried and true way of asking questions and they were doing what they were used to doing.”
The only political appointee at the BLS is the commissioner, who, Groshen said, does not have access to the data and only sees the finalized report.
mahatmakanejeeves
(57,664 posts)Nonfarm payroll employment rises by 2.5 million in May; unemployment rate falls to 13.3% http://go.usa.gov/vrK #JobsReport #BLSdata
Link to tweet
Impact of the COVID-19 pandemic on The Employment Situation for May 2020 https://go.usa.gov/xwBKP #JobsReport #BLSdata
Link to tweet
See our interactive graphics on today’s #JobsReport http://go.usa.gov/cn5B4 #BLSdata #DataViz
Link to tweet
Understanding BLS Unemployment Statistics #JobsReport #BLSdata
Link to tweet
mahatmakanejeeves
(57,664 posts)It used to be that you could get free access to articles in The Wall Street Journal. by going in through TWSJ.'s Twitter account or the Twitter accounts of the authors:
For free access to articles in The Wall Street Journal., trying going in through the authors' Twitter feeds:
This trick doesn't seem to work anymore, but you might be able to get in if they've slipped up. Here are those accounts:
* * * * *
The Wall Street Journal.: @WSJ
https://twitter.com/wsj
Wall Street Journal
Breaking news and features from the WSJ.
* * * * *
Ben Leubsdorf: @BenLeubsdorf
https://twitter.com/BenLeubsdorf
I cover the economy at @WSJ. @ConMonitorNews, @AP, @the_herald alum. DC native. Hyperactive news omnivore. Also I like burritos. ben.leubsdorf@wsj.com
* * * * *
Josh Zumbrun: ?@JoshZumbrun
https://twitter.com/JoshZumbrun
National economics correspondent for the Wall Street Journal. Covering the world's usual state of greed and disorder, confusion and apathy. josh.zumbrun@wsj.com
* * * * *
Nick Timiraos: @NickTimiraos
https://twitter.com/NickTimiraos
National economics correspondent, The Wall Street Journal
Please look at the tweets, as Nick Timiraos likes to slice and dice the data every which way. Also, link to the "11 charts " article from his Twitter feed to get past TWSJ.'s paywall.
* * * * *
Jeffrey Sparshott: @jeffsparshott
https://twitter.com/jeffsparshott
Jeffrey.Sparshott@wsj.com
* * * * *
Paul Vigna: @paulvigna
https://twitter.com/paulvigna
Markets, bitcoin, and the zombie apocalypse.
* * * * *
Eric Morath: @EricMorath
https://twitter.com/EricMorath
Eric.Morath@wsj.com
I'm a Wall Street Journal economy reporter, dad, husband and Spartan for life. eric.morath@wsj.com
Washington DC
blogs.wsj.com/economics/
* * * * *
Sarah Chaney: ?@sechaney
https://twitter.com/sechaney
Economy Reporter at The Wall Street Journal. Tar Heel. sarah.chaney@wsj.com
* * * * *

Steelrolled
(2,022 posts)but where I live the reopening plans were announced in May, many to take effect in June, and once they had a date, businesses started to gear up to be ready. It seems we had moved past the bottom at that point.
FBaggins
(26,775 posts)But these figured would normally have more lag than that. The survey is taken over multiple weeks.
progree
(10,924 posts)16. It also produces Employed (but not the headline non-farm employment number), Unemployed, Labor Force, Labor Force Participation Rate, and many others. That Employed number was up 3.8 M, incidentally.
The Establishment survey, which produces the headline non-farm payroll numbers, its a bit more complicated. But from something I saw somewhere, the vast majority of workers are paid either weekly, every 2 weeks, or twice a month. Only a small percentage are paid once a month. So a payroll period that includes the 12th of the month would capture about what was happening in the first half of the month
From MKJ's #15 above which excerpts the entire summary, including the Covid19 section:
SayItLoud
(1,702 posts)Today alone, billions of $, yes BILLONS of $ have been made in the market fluctuation on this number. Just sayin....#TrumpCrimeFamily.
Bengus81
(6,936 posts)And a tanking stock market.
beachbumbob
(9,263 posts)BUT BLS has many ways to manipulate the numbers as well
Lonestarblue
(10,106 posts)I get a morning email from Bloomberg News summarizing major happenings. Here’s a paragraph in this morning’s email.
“U.S. payrolls may have dropped by 7.5 million last month, sending the unemployment rate to a Depression-era 19.1%, consensus shows. So far during the pandemic, the losses have hit those least able to absorb the blow, with a concentration in lower-wage labor markets, such as retail and restaurants. The May report may extend into white-collar positions.”
This was from yesterday’s estimate before the numbers came out this morning. Hard to believe that Bloomberg’s analysts would be 6% off.
progree
(10,924 posts)Last edited Fri Jun 5, 2020, 12:04 PM - Edit history (2)
https://www.marketwatch.com/economy-politics/calendar"Actual" from this mornings BLS report:
Jobs: +2.5 M, unemployment rate: 13.3%
Jobs: -7.25 M, unemployment rate: 19.0% <-- repeating the forecast again here for ease of comparison
Edited to add, this from Yahoo Finance (doesn't say which economists) :
https://finance.yahoo.com/news/adp-jobs-report-may-coronavirus-pandemic-121650795.html
And as a reminder, ADP's report, which came out 2 days ago found 2.76 M PRIVATE sector jobs LOST. Note that ADP only processes about 20% of payrolls, I don't know what they do to estimate the other 80%. https://finance.yahoo.com/news/adp-jobs-report-may-coronavirus-pandemic-121650795.html
DallasNE
(7,403 posts)2.5 million workers lose their jobs and have the economy gain 2.5 million jobs. That would mean a staggering 5 million jobs were created in May. Does that really make sense? I don't trust these numbers. It looks like Trump wanted good numbers and BLS gave them to him.
yaesu
(8,020 posts)
WePurrsevere
(24,259 posts)Closed or greatly reduced by COVID quarantine open back up. If it comes from Trump and his admin, it's probably also very high in the BS department.
If Trump had done his job properly back at the very beginning of this there wouldn't have been such high numbers of unemployed or DEAD because of his allowing this virus to hit harder than it should have.
mahatmakanejeeves
(57,664 posts)Trouncing Expectations by 10 Million Jobs, the Labor Market’s Comeback Has Begun
June 5, 2020 5 minute read
BumRushDaShow
(129,662 posts)was there any revisions in data for April and March in the report?
progree
(10,924 posts)From MHMKJ post#15 excerpt of BLS report
BumRushDaShow
(129,662 posts) progree
(10,924 posts)So a +2.5 M "actual" is about 10 M above these expectations.
Note BTW: March and April were revised down a combined 0.64 M, that is in the bad direction (more jobs lost than previously reported).
progree
(10,924 posts)Last edited Mon Jun 8, 2020, 02:43 PM - Edit history (2)
# Nonfarm Employment (Establishment Survey, https://data.bls.gov/timeseries/CES0000000001
Monthly changes: https://data.bls.gov/timeseries/CES0000000001?output_view=net_1mth
NOT SEASONALLY ADJUSTED: https://data.bls.gov/timeseries/CEU0000000001
# INFLATION ADJUSTED Weekly Earnings of Production and Non-Supervisory Workers http://data.bls.gov/timeseries/CES0500000031
# Labor Force http://data.bls.gov/timeseries/LNS11000000?output_view=net_1mth
# Employed http://data.bls.gov/timeseries/LNS12000000?output_view=net_1mth
NOT SEASONALLY ADJUSTED: https://data.bls.gov/timeseries/LNU02000000
# Unemployed http://data.bls.gov/timeseries/LNS13000000
# ETPR (Employment-To-Population Ratio) aka Employment Rate http://data.bls.gov/timeseries/LNS12300000
# LFPR (Labor Force Participation rate) http://data.bls.gov/timeseries/LNS11300000
# Unemployment rate http://data.bls.gov/timeseries/LNS14000000
# U-6 unemployment rate http://data.bls.gov/timeseries/LNS13327709
# NILF -- Not in Labor Forcehttp://data.bls.gov/timeseries/LNS15000000
# NILF-WJ -- Not in Labor Force, Wants Job http://data.bls.gov/timeseries/LNS15026639
# Part-Time Workers who want Full-Time Jobs (Table A-8's Part-Time For Economic Reasons) http://data.bls.gov/timeseries/LNS12032194
# Part-Time Workers (Table A-9) http://data.bls.gov/timeseries/LNS12600000
# Full-Time Workers (Table A-9) http://data.bls.gov/timeseries/LNS12500000
# Multiple Jobholders as a Percent of Employed (Table A-9) https://data.bls.gov/timeseries/LNS12026620
# Civilian non-institutional population https://data.bls.gov/timeseries/LNS10000000
# Nonfarm Employment (Establishment Survey, Monthly changes: https://data.bls.gov/timeseries/CES0000000001?output_view=net_1mth
2019 269 1 147 210 85 182 194 207 208 185 261 184
2020 214 251 -1373 -20687 2509
Feb and March of 2020 are Corrected. April and May are Preliminary
# Employed from the separate Household Survey
Employed http://data.bls.gov/timeseries/LNS12000000?output_view=net_1mth
2019 -198 239 -125 -45 148 304 198 549 403 246 -8 267
2020 -89 45 -2987 -22369 3839
Jan and Feb of each year are affected by changes in population controls
# Black unemployment rate https://data.bls.gov/timeseries/LNS14000006
First 5 months of 2020: 6.0, 5.8, 6.7, 16.7, 16.8 Trump: "what have you got to lose?"
# White unemployment rate https://data.bls.gov/timeseries/LNS14000003
First 5 months of 2020: 3.1, 3.1, 4.0, 14.2, 12.4
https://www.democraticunderground.com/10142508011
Donald Trump says he hopes George Floyd, who was killed by police on Memorial Day after an officer forced his knee on the back of his neck for nearly nine minutes while facing the ground in handcuffs, is "looking down right now" and saying today is a "great thing that's happening for our country" as the nation's unemployment rate declined but remains higher than during the Great Recession.
The president said: "Hopefully George is looking down right now and saying, 'This is a great thing that's happening for our country. It's a great day for him, it's a great day for everybody. It's a great day for everybody. This is a great, great day."
Asked how the rate of unemployment among black Americans can be considered a "victory" as it continues to increase, the president told a reporter outside the White House, "You are really something."

aggiesal
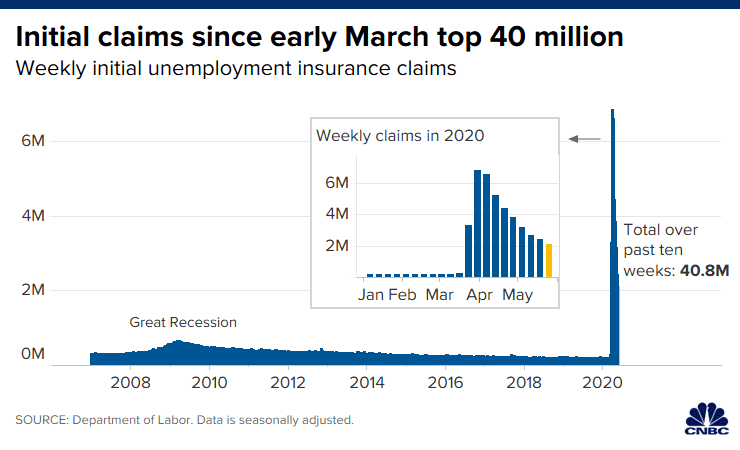
(8,937 posts)This is data based on week ended May 16, so it doesn't include the last 2 weeks, which now put unemployed at 42+ Million
Some skyscrapers on the right side of the graph
Check out at the skyscraper on the right side of the graph (Looks like the Sears Tower)
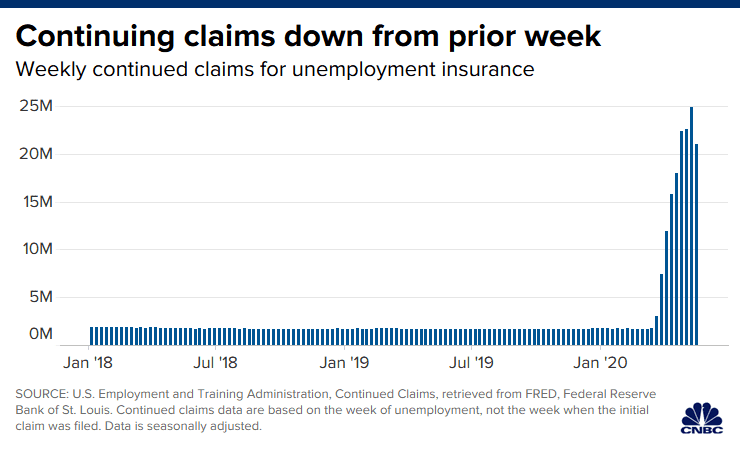
progree
(10,924 posts)Unemployment insurance claims - https://www.democraticunderground.com/10142507000#post18 .. Week ending May 30: 1.877 M .. 42.65 M claims filed since pandemic beginning. After seeing a decline in the previous week’s report, continuing claims, which lags initial jobless claims data by one week, increased to 21.49 million in the week ending May 23,
article has the weekly claims figures.
Figures above don't include the approximate 8 M who claimed Pandemic Unemployment Assistance, under the CARES Act
BLS's Unemployed: 20.985 M. http://data.bls.gov/timeseries/LNS13000000
Apparently about half those who file claims also find jobs fairly quickly (or get their jobs back). Surprises me, but wouldn't be the first time.
There's this wrinkle: the BLS's unemployed, also the unemployment rate, counts only those who have looked for work in the past 4 weeks (and still out of work) as unemployed (part-timers are also considered employed).
The BLS unemployment numbers are not a count of people claiming or collecting unemployment insurance. Rather they are from a survey of 60,000 households. They do included self-employ / gig / contract workers the same as regular paycheck workers.
aggiesal
(8,937 posts)so you're unemployment doesn't count in these numbers.
progree
(10,924 posts)and wants a job, is available for a job, and say they looked for work in the past 4 weeks. Regardless of whether they have filed for unemployment benefits, are collecting benefits, exhausted their benefits, or any of that.
The BLS numbers today come from a Household Survey of 60,000 households and their unemployment insurance status does not matter one way or another.
It's a myth that people who have exhausted their benefits (or aren't collecting benefits for any reason) are not counted as unemployed.
http://www.bls.gov/cps/cps_htgm.htm (search the page for the word "insurance" )
aggiesal
(8,937 posts)you have to fill out a form, for the previous 2 weeks showing you are
looking for work, to collect benefits.
On this form you have to show that you've searched for work, by submitting
resumes, applying for a jog, or having an interview.
Once you exhaust your benefits, they don't send you any form to fill out.
So, if you've exhausted your benefits, and you have no form to show
you're looking, how are you included in the unemployment numbers
if the government doesn't know you are looking for work?
In the link you supplied, these people would be considered
"not in the labor force["
The government office would have to call, mail, email or text you, to
find out your job search status, which I've never seen happen.
I'm not saying it doesn't happen, I just haven't seen it.
progree
(10,924 posts)completely separate from the unemployment offices. The way the government "knows" how many people are employed and unemployed, in the labor force or not, yada, for the purpose of the monthly jobs reports, is from that 60,000 household survey.
The Labor Force is defined as employed + unemployed, where the unemployed number is obtained as I stated.
The reason they don't calculate the unemployment rate or unemployed from the unemployment office numbers is for precisely the reason you state.
Or in the BLS's words: https://www.bls.gov/cps/cps_htgm.htm
In addition, the insured unemployed exclude the following:
Unemployed workers who have exhausted their benefits.
Unemployed workers who have not yet earned benefit rights (such as new entrants or reentrants to the labor force).
Disqualified workers whose unemployment is considered to have resulted from their own actions rather than from economic conditions; for example, a worker fired for misconduct on the job.
Otherwise eligible unemployed persons who do not file for benefits.
Because of these and other limitations, statistics on insured unemployment cannot be used as a measure of total unemployment in the United States. Indeed, over the past decade, only about one-third of the total unemployed, on average, received regular UI benefits.
FBaggins
(26,775 posts)The official unemployment rates have nothing to do with whether or not you currently qualify for unemployment benefits.
progree
(10,924 posts)and part-time workers who say that want full-time work)
https://data.bls.gov/timeseries/LNS13327709
was 6.7% at its low point in December.
U-3, the official headline unemployment rate, only counts those who have looked for work sometime in the past 4 WEEKS. And all part-time workers are considered employed in U-3.
http://data.bls.gov/timeseries/LNS14000000

Cryptoad
(8,254 posts)yessssiree,,,,,,, everythang rosy now (well maybe at least orangey) !
progree
(10,924 posts)Asked how the rate of unemployment among black Americans can be considered a "victory" as it continues to increase, the president told a reporter outside the White House, "You are really something."
Note: The unemployment rate for African Americans actually went up 16.8% in the May jobs report, while the unemployment rate for whites went down.
More: (thanks Native! ) https://www.democraticunderground.com/10142508011
# Black unemployment rate https://data.bls.gov/timeseries/LNS14000006
First 5 months of 2020: 6.0, 5.8, 6.7, 16.7, 16.8 Trump: "what have you got to lose?"
# White unemployment rate https://data.bls.gov/timeseries/LNS14000003
First 5 months of 2020: 3.1, 3.1, 4.0, 14.2, 12.4
mahatmakanejeeves
(57,664 posts)It takes you to this:
The May jobs report had "misclassification error" that made the unemployment rate look lower than it is. Here’s what happened.
Link to tweet
BumRushDaShow
(129,662 posts)that was introduced into the calculations, with the assumption that the "Paycheck Protection Program" under the "CARES Act" somehow negated a certain segment of unemployment because people were supposedly not "unemployed" but were temporarily "out of work" with the assumption and expectation that they would be rehired.
mahatmakanejeeves
(57,664 posts)Good morning.
It's going to be hot and humid in DC today, with, as always, a chance of storms. The reduction in economic activity and thus commuting means that it won't be hazy, hot, and humid, DC's typical summer weather condition.
I'm not going to any demonstrations. I have too much housework to do. Also, Covid-19? I'll be signing off in a few minutes.
Seriously, I have to attend to this mess. I'll be dropping in throughout the day.
See ya.
BumRushDaShow
(129,662 posts)and don't forget the tornadoes that threaten to appear in Montgomery County (Rockville/Gaithersburg/Bethesda area) when it gets hot and humid down there (don't ask me why I know that). 
progree
(10,924 posts)Last edited Tue Jun 9, 2020, 04:28 PM - Edit history (4)
April was "almost 5 percentage points", and May was "about 3 percentage points" off (i.e. the unemployment rates in the respective months would be higher by these amounts were it not for these mis-classification errors).
The values as published in April were 14.7%, and in May was 13.3%
Using corrected values for both April and May, the unemployment rate was almost 19.7% in April and about 16.3% in May.
This misclassification error is spelled out in a big Cov19 box at the bottom of the BLS summary that was released as part of the original release at 830 AM ET Friday June 5. (So it's not a correction they reported later -- the correction box note was included as part of the original release. Unfortunately none of the numbers are corrected -- the note just says the numbers are wrong. Sigh).
Here is the bottom of the Covid 19 box in the BLS's jobs report summary
https://www.bls.gov/news.release/empsit.nr0.htm .
| reasons" (over and above the number absent for other reasons in a typical May) had |
| been classified as unemployed on temporary layoff, the overall unemployment rate |
| would have been about 3 percentage points higher than reported (on a not seasonally |
| adjusted basis). However, according to usual practice, the data from the household |
| survey are accepted as recorded. To maintain data integrity, no ad hoc actions are |
| taken to reclassify survey responses.
Similarly it was also presented that that way in the bottom of the March and April summaries, just with different values "almost 1 percentage point" in March and "almost 5 percentage points" in April.
What's particularly irksome is that they waited until the bottom of the summary to tell us. And while it's in a big box, its a long multi-paragraph box, and it doesn't tell us what we need to know until the final sentence of that long box. (Click on the above link to see the original (and current) release and scroll down and down).
The Washington Post article says that despite efforts to correct the problem (good article on the problem, BTW), "there are lots of field staff who had a tried and true way of asking questions and they were doing what they were used to doing.”
https://www.washingtonpost.com/business/2020/06/05/may-2020-jobs-report-misclassification-error
(I think we've all had coworkers like that. Still, I'm disappointed that after 3 months they still can't get a handle on it -- they made the same kind of error in March and April -- April's error was even larger, "almost 5 percentage points".
... One of the first questions that gets asked is did the person do any work “for pay or profit?” There are then 45 pages of follow up questions that come after that. One of those questions asks if someone was “temporarily absent” from the job and why that absence occurred. One of the responses is “other.”
The BLS instructed surveyors to try to figure out if someone was absent because of the pandemic and, if so, to classify them as on “temporary layoff,” meaning they would count in the unemployment data. But some people continued to insist they were just “absent” from work during the pandemic, and the BLS has a policy of not changing people’s answers once they are recorded. It’s how the BLS protects again bias or data manipulation.
... “It’s surprising the BLS couldn’t come up with fixes to make this work in May,” said Erica Groshen, the former BLS commissioner under Obama. But, she adds, “This is a very unusual situation. There are lots of field staff who had a tried and true way of asking questions and they were doing what they were used to doing.”
The only political appointee at the BLS is the commissioner, who, Groshen said, does not have access to the data and only sees the finalized report.
This is a good one non-paywalled article that goes into depth:
https://www.commondreams.org/news/2020/06/06/labor-bureau-says-misclassification-error-making-unemployment-rate-look-lower-it
There is some woo woo around (que Art Bell theme music) that
(a) this misclassification error only happened in May
(b) it was done to make it look like that the unemployment rate DEcreased from April's 14.7% to May's 13.3%, whereas -- those of us who are really sharp-eyed and brilliant, and who don't automatically believe and gush over everything that the Trump administration produces -- really know that the unemployment rate INcreased from April's 14.7% to May's 16.3%, (again: using corrected values for both months, it decreased from almost 19.7% in April to about 16.3% in May.)
I hope that this woo woo wasn't in that thread you found. I've stomped on it in the wee hours this morning in a couple of other threads, but no doubt it's all over the place. Art Bell is no doubt looking down and smiling, and many people are patting themselves on their backs over their self-perceived perspicacity.
Oh another thing being said in those threads is that this error, if it were corrected, would mean that the jobs number would drop from a 2.5 M gain to a 16.5 M loss, a swing of 19.0 M. I don't know where that wild math comes from.
For one thing, the headline 2.5 M jobs gains comes from the Establishment Survey, which is different than the Household Survey that produces the unemployment numbers and rates. It was the Household Survey that had the misclassifcation error, not the Establishment Survey.
The other thing is that the unemployment rate is the number of unemployed divided by the labor force. Given that the labor force is 158,227,000 (the classification error doesn't change that number), a 3% increase in the unemployment rate would be caused by a 4.8 million increase in the unemployed, far short of 19 million alleged error.
I don't know in how many threads during the past month that I posted about APRIL's "almost 5 percentage" point error and pointed out that a correction would increase APRIL's 14.7% to "almost" 19.7%. But it was a hell of a lot of threads. But the woo woo is out there that this kind of thing only happened in May.
mahatmakanejeeves
(57,664 posts)where these issues are addressed. It goes back to an article in the WaPo. I don't have unlimited access at home, so I can't see if any of the comments to that article are along the lines of your post.
I didn't include the explanatory box from the BLS at first, but I went back to add it yesterday morning not long after I had originally posted.
Odd number, yesterday's, but I guess sometimes that happens. The Post wasn't expecting it. I know what happened. They had a canned story ready to go. All they had to do was fill in the blanks. What they weren't counting on was an increase in employment, rather than yet another increase in unemployment.
I'm taking a break from cleaning house.
Thanks again.
progree
(10,924 posts)percentage point error and everyone should know about it, in particular in this thread which I consider the flagship of the monthly jobs reports.
Over the past month, I posted endlessly about the same misclassification error in the April report (the error in April was "almost 5 percentage points" ), which, if corrected, would have increased the unemployment rate from the reported 14.7% to almost 19.7%
What I'm ranting about in #78 is the way that the 3 percentage point error has been played into a conspiracy to hide an INcrease in the unemployment rate from April to May -- and that if corrected, would cause a massive swing from 2.5 M jobs gain to a 16.0 M jobs lost. Both false. Details in #78. It's that woo that I don't want to see here.
mahatmakanejeeves
(57,664 posts)I'm half tempted to go back and append the BLS report for the other affected months, but I doubt that anyone will go looking for them.
Thanks again.
progree
(10,924 posts)As for April's thread ( https://www.democraticunderground.com/10142489386 ), I already posted that 5 percentage point error information in #31:
"31. Unemployment rate may be almost 5% higher than the reported 14.7%, says BLS in so many words:"
and #51.
By the way, I looked at the thread you posted a link to in your #74 here -- BGD's thread https://www.democraticunderground.com/100213552085
and it was fortunately not too bad (I'm talking about the responses, not the OP ... the OP was perfectly fine) -- it looks like Igel in #3 tamped the woo in the responses down to some extent. Nothing like a couple of other threads I've run across that went on at great length to manufacture B.S..
and the Washington Post article in that thread (and in your #74 here) was an excellent discussion and also talked about the March and April errors, and the conspiracy theorists.
https://www.washingtonpost.com/business/2020/06/05/may-2020-jobs-report-misclassification-error
Bengus81
(6,936 posts)mahatmakanejeeves
(57,664 posts)mahatmakanejeeves
(57,664 posts)I'm doing this for archival purposes, so that all the threads are connected. I'm not expressing any opinion on the topics of the other threads.
A 'misclassification error' made the May unemployment rate look better than it is.
mahatmakanejeeves
(57,664 posts)Archival purposes; yada, yada, yada.
progree
(10,924 posts)unfortunately. The usual woo -- all the clever people catching the admin insiders in a conspiracy to propel the stock market up so they can sell before the word gets around Monday morning (despite the error being pointed out by the BLS in their original (and only) 830 AM ET Friday release (and still there) in a big box at the bottom of the summary, and despite the fact that the same thing happened in March and April and was pointed out in the original (and only) releases of these reports (and still there), and was much written about at the time, certainly the April one was.
I read about 3 MSM reports on it in the first 2 hours after release that also pointed it out.
And that anyone who bothers to read or skim even just the summary would have seen it. I mean who wouldn't read a box pointing out Covid19 issues with the report?
But anyway, it was widely-reported last month. I have no doubt that plenty of people who take these reports seriously were on the lookout that what occurred in March and April might occur again in May.
mahatmakanejeeves
(57,664 posts)progree
(10,924 posts)Americans"?)
The statistic that Trump got his 94 million jobless from was Not in Labor Force https://data.bls.gov/timeseries/LNS15000000
It was 101.8 Million in May 2020.
(BTW this number isn't affected by the unemployed / unemployment rate 3 percentage point correction, since that involved misclassifying some of the unoffically unemployed (U-3) as employed. Both groups are counted as part of the labor force, because the officially unemployed (U-3) are people who have looked for work in the past 4 weeks and are ready and willing to take a job and all that.
The Not In the Labor Force are jobless people who have not looked for work in the past 4 weeks or indicated they aren't willing or able to take a job now. This includes a LOT of people -- not just discouraged people who have given up looking for work, but also retired people, not-working elderly including centenarians, students (age 16 and over -- all the main BLS stats are for 16 and over) ) home-makers, etc.
So it was very disingenuous of Trump to hang all these people around President Obama's neck as "jobless Americans".
Now we can give Trump back his own medicine by talking about 101 million jobless Americans under Trump.
(Actually, I don't think we should, given that it would be called out and hurt our credibility, and why do that when things are horrible enough without being disingenous).
And that 101.8 M doesn't include the officially unemployed (who ARE counted as part of the labor force). The officially unemployed in May was 21 Million (and when correct it for that 3% misclassification error is about 26 Million).
Back to the Not In Labor Force: What really matters for that statistic as far as what we think of as unemployed, is
Not In Labor Force, Wants Job: https://data.bls.gov/timeseries/LNS15026639
8.96 Million in May (this stat is not affected by the 3% misclassification error).
progree
(10,924 posts)misinformation like making it sound like it was a one-day one-time problem (the misclassification of millions of unemployed workers as being employed) :
The same problem occurred in March and April.
And to be clear: the numbers in the report are wrong. They were not corrected. The only "correction" is a long-winded note to point out that the numbers are mistaken, at least the employment and unemployment numbers (the error was that some unemployed were miscategorized as employed).
3 months in a row. 3 months in a row.
Details #12 in this thread
https://www.democraticunderground.com/?com=view_post&forum=1002&pid=13560715
False. An error notice was put in the report. But not a single number was corrected. Not one. The reader was left to do the math: 13.3% + "about 3 percentage points" = "about 16.3%". (And the reader was also left to seasonally adjust the "about 3 percentage points" too. Nice.)
They explicitely said the error was not corrected:
https://www.bls.gov/news.release/empsit.nr0.htm
| reasons" (over and above the number absent for other reasons in a typical May) had |
| been classified as unemployed on temporary layoff, the overall unemployment rate |
| would have been about 3 percentage points higher than reported (on a not seasonally |
| adjusted basis). However, according to usual practice, the data from the household |
| survey are accepted as recorded. To maintain data integrity, no ad hoc actions are |
| taken to reclassify survey responses.
And that's for just the national U-3 unemployment rate. What about black unemployment? white? male? female? the different age groups? U-4, U-5, U-6? And their demographic subgroups? How about states and other geographic entities?
And what about the unemployed count in thousands, both overall (20,985,000) and for the demographic subgroups? Any of those corrected? Nope, I didn't think so.
And the Employed number was not corrected. If 4.7 million were misclassified as employed, that means that the reported 3.8 M gain in Employed is really a 0.9 million LOSS.
http://data.bls.gov/timeseries/LNS12000000
Needless to say, all the demographic subgroups of Employed are wrong too.
And are you telling us that it all came to light in a single day? Particularly considering the same errors occurred in March and April?
And hell, after all this time, the March and April unemployment rates haven't been corrected. E.g. April is still reported as 14.7% in the data series, when the correct number is 14.7% + "almost 5 percentage points" = almost 19.7%.
See here for the unemployment rate: https://data.bls.gov/timeseries/LNS14000000
mahatmakanejeeves
(57,664 posts)progree
(10,924 posts)I wish I could, at long last, stop playing whack-a-mole on this job report, like I've spent about half my time doing since Friday morning.
In April, the official unemployment rate number was 14.7% which they admitted was low by "almost 5 percentage points". That means the corrected number is 14.7% + "almost 5 percentage points" = "almost" 19.7%.
In May, the official unemployment rate number was 13.3% which they admitted was low by "about 3 percentage points". That means the corrected number is 13.3% + "about 3 percentage points" = "about" 16.3%.
Details (in this thread): https://www.democraticunderground.com/?com=view_post&forum=1014&pid=2508905
But I know people are going to be yammering endlessly for the next month about how the unemployment rate is really 20%.
That said, the post you linked to clearly spelled out the April and May numbers, and right near the beginning, so I'm glad to see that I don't have to comment on it. Whew. Except for the horrible horrible horrible title line:
progree
(10,924 posts)Last edited Sat Jun 20, 2020, 02:22 PM - Edit history (2)
Various excerpts
https://wolfstreet.com/2020/06/11/a-word-about-the-chaos-in-the-unemployment-data-week-12-of-the-u-s-labor-market-collapse/
by Wolf Richter • Jun 11, 2020 •
No one was prepared for a collapse like this. The data are all over the place. Two government agencies differ by 9 million unemployed. The jobs crisis bottomed in May. But “over 30 million” people remain without work. Making sense of the chaos.
By Wolf Richter for WOLF STREET.
Even Fed chairman Jerome Powell, in his FOMC-meeting news conference yesterday, expressed his bafflement with the chaos in the unemployment data being reported by two government agencies that differ by give-or-take 9 million unemployed, which is huge:
• The Department of Labor reported this morning that 29.5 million people were receiving state or federal unemployment insurance benefits (not seasonally adjusted).
• The Bureau of Labor Statistics reported last Friday in a shock-and-awe data set that only 21 million people were unemployed based on household surveys, though it acknowledged a shock-and-awe systematic error and that without this error, it would have reported 25 million as unemployed.
It’s even worse than it looks. The total number of people who have lost their work – employees and gig workers – and who are still out of work must be above the 29.5 million insured unemployed because many people don’t qualify for any benefits. I don’t know where this final number is, but it is likely well above 30 million. ..............(more)
===============================================
Much more at the link. It explains that there are two sets of unemployment insurance claims -- the old-fashioned state data, and the new federal "Pandemic Unemployment Assistance" (PUA) program for gig and contract workers that were never qualified for the state unemployment programs. And the two together total 29.5 million according to continuing claims -- claims that are in their second or later week and that are qualified for benefits.
===============================================
As for the 43 million in claims you keep hearing about, that's the sum of the initial claims over the past 11 weeks.
https://www.businessinsider.com/us-weekly-jobless-claims-preview-economists-forecast-millions-unemployment-insurance-2020-6
Whereas continuing claims in the latest week available, week ending May 30 was 20.929 million seasonally adjusted (18.920 million not seasonally adjusted). https://www.dol.gov/sites/dolgov/files/OPA/newsreleases/ui-claims/20201216.pdf
(Both the above numbers, the 43 million initial claims, and the continuing claims numbers -- 20.929 million seasonally adjusted (18.920 million not seasonally adjusted) -- are just the states programs and do not include the federal Pandemic Unemployment Assistance program.)
Continuing claims are claims in their second or later week, i.e. all claims except those in their first week.
One big difference is that some of the 43 M found jobs and some dropped out of the unemployment insurance system for other reasons (e.g. quit looking for work or otherwise did not follow the rules).
But anyway, I know of no economist that uses the sum of initial claims for the past 11 weeks as an estimate of the number of unemployed.
Though like Wolf Richter enumerates, the unemployment insurance numbers of all varieties (and Friday's BLS jobs report of the unemployed / unemployment rate -- even after correcting for that embarassing mistake they've admitted have occurred 3 months in a row) leave out a lot of unemployed people who want to work.
It should further be noted that the unemployment rate and the unemployment level from the BLS first Friday jobs report is obtained from a Household Survey of 60,000 households, and is not in any way connected to the state or federal unemployment insurance claims numbers or the number receiving benefits or any of that. These are separate statistics for separate purposes.
And neither are very good estimates for what most people consider unemployed people.
For example the unemployment insurance continuing claims are only a measure of people getting (or at least eligible for) benefits, and following the rules to maintain their benefit status, and manage to overcome the barriers some states' unemployment benefits systems imposes. That leaves out many unemployed. (And one must remember to add the numbers for both the states and the federal programs).
The first Friday (usually) monthly BLS job report of the unemployment rate and the unemployment level in thousands is based on a Household Survey of 60,000 households and only counts those who are (a) have actively sought work in the past 4 weeks (b) are willing and ready to take a job. That leaves out people who have given up looking for work for the time being, and/or are taking some course work to enhance their resume and job skills, for example, and thus are not ready and willing to take a job now.
It also counts all part-time workers as "employed" and therefore not unemployed.