Welcome to DU! The truly grassroots left-of-center political community where regular people, not algorithms, drive the discussions and set the standards. Join the community: Create a free account Support DU (and get rid of ads!): Become a Star Member Latest Breaking News General Discussion The DU Lounge All Forums Issue Forums Culture Forums Alliance Forums Region Forums Support Forums Help & Search
kristopher

(29,798 posts)
Sun Aug 4, 2013, 10:12 PM Aug 2013

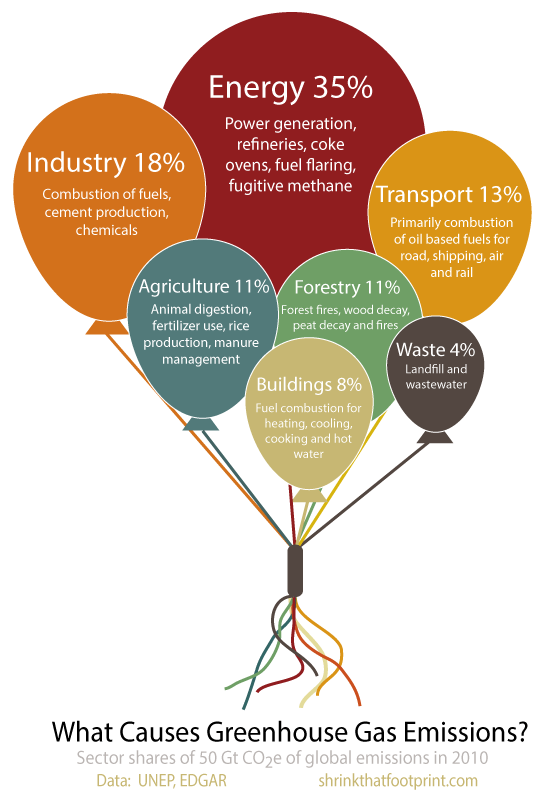
Greenhouse emissions explained in 7 balloons

Graph of the Day: Greenhouse emissions explained in 7 balloons


In 2010 human activity caused 50 Gt CO2e of greenhouse gas emissions.

These emissions were 76% carbon dioxide (CO2), 16% methane (CH4), 8% nitrous oxide (N20) and 2% F-gases.

The big terrestrial emitters were China (23%), the USA (14%), Europe (10%), India (5%) and Russia (5%).

And the primary sources of emissions were energy (35%), industry (18%), transport (13%), agriculture (11%), forestry (11%), buildings (8%) and waste (4%).

The sources are explained in more detail in the balloons above, which technically shouldn’t float so well...

http://reneweconomy.com.au/2013/graph-of-the-day-greenhouse-emissions-explained-in-7-balloons-73506

Latest Discussions»Issue Forums»Editorials & Other Articles»Greenhouse emissions expl...