Video & Multimedia
Related: About this forumBernie Sanders On West Virginia Win, Path Forward Full Interview In MSNBC
[link:
| = new reply since forum marked as read
Highlight:
NoneDon't highlight anything
5 newestHighlight 5 most recent replies
= new reply since forum marked as read
Highlight:
NoneDon't highlight anything
5 newestHighlight 5 most recent replies

appalachiablue
(41,148 posts)Last edited Fri May 13, 2016, 12:20 AM - Edit history (1)
- Think Progress, Climate: HOW ANTI-COAL BERNIE SANDERS WON COAL COUNTRY, May 12, 2016.

If you know about West Virginia’s attitude toward coal, and you also know about Sen. Bernie Sanders’ (I-VT) attitude toward coal, then Tuesday night’s Democratic presidential primary results might have come as a bit of a surprise. Sanders — a staunch environmentalist pushing for more pollution regulations and a nationwide carbon tax — easily won West Virginia over his opponent Hillary Clinton on Tuesday. His win, some environmentalists said, was proof that you don’t have to be pro-coal to win in coal country.
Still, it was confusing. Coal clearly remains politically important to West Virginia voters — just look at Clinton, who has been facing backlash and protests there since her infamous March quote: “We’re going to put a lot of coal miners and coal companies out of business.” Sanders unarguably espouses more intense anti-coal, anti-fossil fuel rhetoric than Clinton. “To hell with the fossil fuel industry” is one of his more memorable quotes. Sure, many West Virginia voters wouldn’t love Sanders’ coal policies — but they probably haven’t thought about them that much.
And yet, Sanders easily beat Clinton among West Virginia voters with coal workers in their families. Fifty-five percent of West Virginia’s Democratic voters with coal workers in their households voted for Sanders on Tuesday, while only 29 percent voted for Clinton.
..“Elections are often more about a decision to vote for stability or change than they are about specific policy proposals,” said Scott Crichlow, an associate professor of political science at West Virginia University. “Sure, many West Virginia voters wouldn’t love Sanders’ coal policies — but they probably haven’t thought about them that much. They already know they don’t like President Obama and Hillary Clinton’s coal policies at all. And a vote against Hillary, in a state where you’ll hear about a supposed ‘war on coal’ non-stop, could very easily be meant to be a vote against the Democratic party’s energy priorities.”
Of course, there are many West Virginia Democrats who voted for Sanders based on the meat of his policy proposals. But there is evidence to support the theory that many West Virginians cast protest votes, and that those votes benefited Sanders in the end.
..Other West Virginia Democrats protested by just not voting for president at all. According to Isbell, 6.2 percent of Democratic ballots across the state were blank for president. The biggest share of blank votes, he said, were in the southern coal counties. “Clinton’s poor reputation with coal country resulted in conservative Democrats either voting for minor candidates, leaving their ballot blank, or voting for Sanders to stick it to Clinton,” Isbell wrote. “Clinton even [lost] to minor candidates combined in two coal counties, and only beating out that protest vote by unimpressive margins in many others.”
Christopher Plein, an associate professor of public administration at West Virginity University, largely agreed.
“Part of understanding West Virginia’s election results is saying that yes, there were protest votes — they were upset with Senator Clinton,” Plein said. “They see Senator Clinton closely tied to the Obama administration, which has been perceived by many as being unfriendly to the coal industry with regulation.”
Still, Plein said, Sanders’ win was not all because of anti-Clinton sentiment. There is genuine appeal in many pockets of the state — including coal country — of an outsider, relatively anti-establishment candidate who has consistently appealed to working class people. Plus, the fact that Sanders (like Clinton) has a plan to transition coal communities to a cleaner energy economy doesn’t hurt either.
“There is this growing awareness and acceptance in West Virginia that we are entering into a post-coal economy … and the state is really facing fundamental challenges for community and economic development,” Plein said. “So a lot of what Senator Sanders is talking about does resonate authentically and genuinely with people.”
Janet Keating, the executive director of the *OHIO VALLEY ENVIRONMENTAL COALITION, has been working on transitioning coal communities in West Virginia for 20 years. She also believes people are starting to recognize that coal is on its way out, and are beginning to look to politicians — like Sanders and Clinton — who will diversify their economies.
More, http://thinkprogress.org/climate/2016/05/12/3777329/bernie-sanders-hillary-clinton-coal-country-west-virginia/
appalachiablue
(41,148 posts)*These Are America’s Richest & Poorest States*, VOA/Voice of America, Sept. 21, 2015.
Mississippi is the nation’s poorest state while Maryland ranks as its richest, according to newly released information from the US Census Bureau. In addition to Mississippi, the three poorest states include West Virginia and Arkansas. Relatively low levels of education could be a factor in the poverty and lower incomes in all three states.
At the other end of the spectrum are Maryland, New Jersey and Alaska, which rank as the country’s richest states.
The median income in Mississippi was $39,680 compared to $73,971 in Maryland.
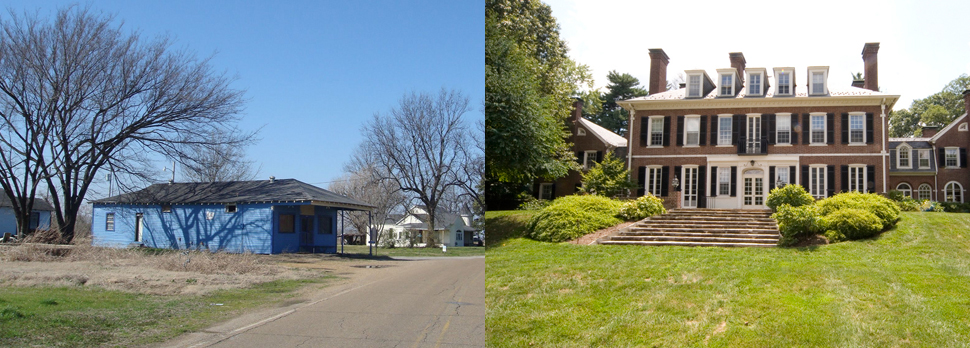
L- A vacant store in Mississippi, America’s poorest state. R- A home in Maryland, the richest state in the U.S., according to US Census data.
Three states — Washington, North Dakota, and Connecticut — reported income increases of more than $2,000 in 2014.
Kentucky, the fifth poorest poor state, experienced a significant decline in income; the typical household earned $1,139 less in 2014 than in 2013. Income levels were essentially the same in 2013 and 2014 in 33 states.
Overall, the United States added 3.2 million new jobs in 2014, up from the 2.3 million jobs that were added in 2013.
At the end of 2014, there were 139 million jobs in the U.S., more than at the start of 2008, the peak before the recession. But not all U.S. states are sharing in this prosperity; the poverty rate has actually increased in 12 states.
The nation’s overall poverty rate was 14.8 percent, which means 46.7 million people were living in poverty in 2014.
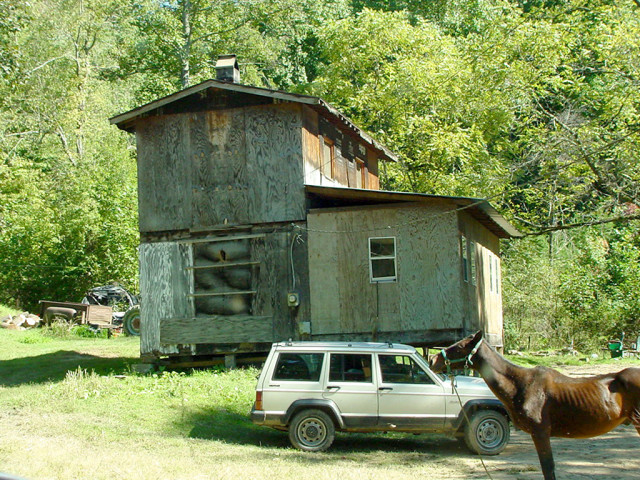
File photo of a home in West Virginia.
The U.S. Census Bureau said these numbers presented no “statistically significant” change from the previous year.
It’s the fourth year in a row that poverty rates were not statistically different from the previous year.
The real median income for family households was $68,426, which was also not statistically different from 2013. However, when compared to 2007- the year before the U.S. fell into its most recent recession- the real median household income is actually 6.5 percent lower.~ 24/7 Wall Street crunched the numbers and came up with the list below.
*AMERICA’S RICHEST AND POOREST STATES*
50. Mississippi – Median household income: $39,680 Poverty rate: 21.5%
49. West Virginia – Median household income: $41,059 Poverty rate: 18.3%
48. Arkansas – Median household income: $41,262 Poverty rate: 18.9%
47. Alabama – Median household income: $42,830 Poverty rate: 19.3%
46. Kentucky – Median household income: $42,958 Poverty rate: 19.1%
45. Tennessee – Median household income: $44,361 Poverty rate: 18.3%
44. Louisiana – Median household income: $44,555 Poverty rate: 19.8%
43. New Mexico – Median household income: $44,803 Poverty rate: 21.3%
42. South Carolina – Median household income: $45,238 Poverty rate: 18.0%
41. Montana – Median household income: $46,328 Poverty rate: 15.4%
40. North Carolina – Median household income: $46,556 Poverty rate: 17.2%
39. Florida – Median household income: $47,463 Poverty rate: 16.5%
38. Oklahoma – Median household income: $47,529 Poverty rate: 16.6%
37. Idaho – Median household income: $47,861 Poverty rate: 14.8%
36. Missouri – Median household income: $48,363 Poverty rate: 15.5%
35. Ohio – Median household income: $49,308 Poverty rate: 15.8%
34. Georgia – Median household income: $49,321 Poverty rate: 18.3%
33. Indiana – Median household income: $49,446 Poverty rate: 15.2%
32. Maine – Median household income: $49,462 Poverty rate: 14.1%
31. Michigan – Median household income: $49,847 Poverty rate: 16.2%
30. Arizona – Median household income: $50,068 Poverty rate: 18.2%
29. South Dakota – Median household income: $50,979 Poverty rate: 14.2%
28. Oregon – Median household income: $51,075 Poverty rate: 16.6%
27. Nevada – Median household income: $51,450 Poverty rate: 15.2%
26. Kansas – Median household income: $52,504 Poverty rate: 13.6%
25. Wisconsin – Median household income: $52,622 Poverty rate: 13.2%
24. Nebraska – Median household income: $52,686 Poverty rate: 12.4%
23. Texas – Median household income: $53,035 Poverty rate: 17.2%
22. Pennsylvania – Median household income: $53,234 Poverty rate: 13.6%
21. Iowa – Median household income: $53,712 Poverty rate: 12.2%
20. Vermont – Median household income: $54,166 Poverty rate: 12.2%
19. Rhode Island – Median household income: $54,891 Poverty rate: 14.3%
18. Wyoming – Median household income: $57,055 Poverty rate: 11.2%
17. Illinois – Median household income: $57,444 Poverty rate: 14.4%
16. New York – Median household income: $58,878 Poverty rate: 15.9%
15. North Dakota – Median household income: $59,029 Poverty rate: 11.5%
14. Delaware – Median household income: $59,716 Poverty rate: 12.5%
13. Utah – Median household income: $60,922 Poverty rate: 11.7%
12. Colorado – Median household income: $61,303 Poverty rate: 12.0%
11. Washington – Median household income: $61,366 Poverty rate: 13.2%
10. Minnesota – Median household income: $61,481 Poverty rate: 11.5%
9. California – Median household income: $61,933 Poverty rate: 16.4%
8. Virginia – Median household income: $64,902 Poverty rate: 11.8%
7. New Hampshire – Median household income: $66,532 Poverty rate: 9.2%
6. Massachusetts – Median household income: $69,160 Poverty rate: 11.6%
5. Hawaii – Median household income: $69,592 Poverty rate: 11.4%
4. Connecticut – Median household income: $70,048 Poverty rate: 10.8%
3. Alaska – Median household income: $71,583 Poverty rate: 11.2%
2. New Jersey – Median household income: $71,919 Poverty rate: 11.1%
1. Maryland- Median household income: $73,971 Poverty rate: 10.1%
More, http://blogs.voanews.com/all-about-america/2015/09/21/these-are-americas-richest-poorest-states/