Economy
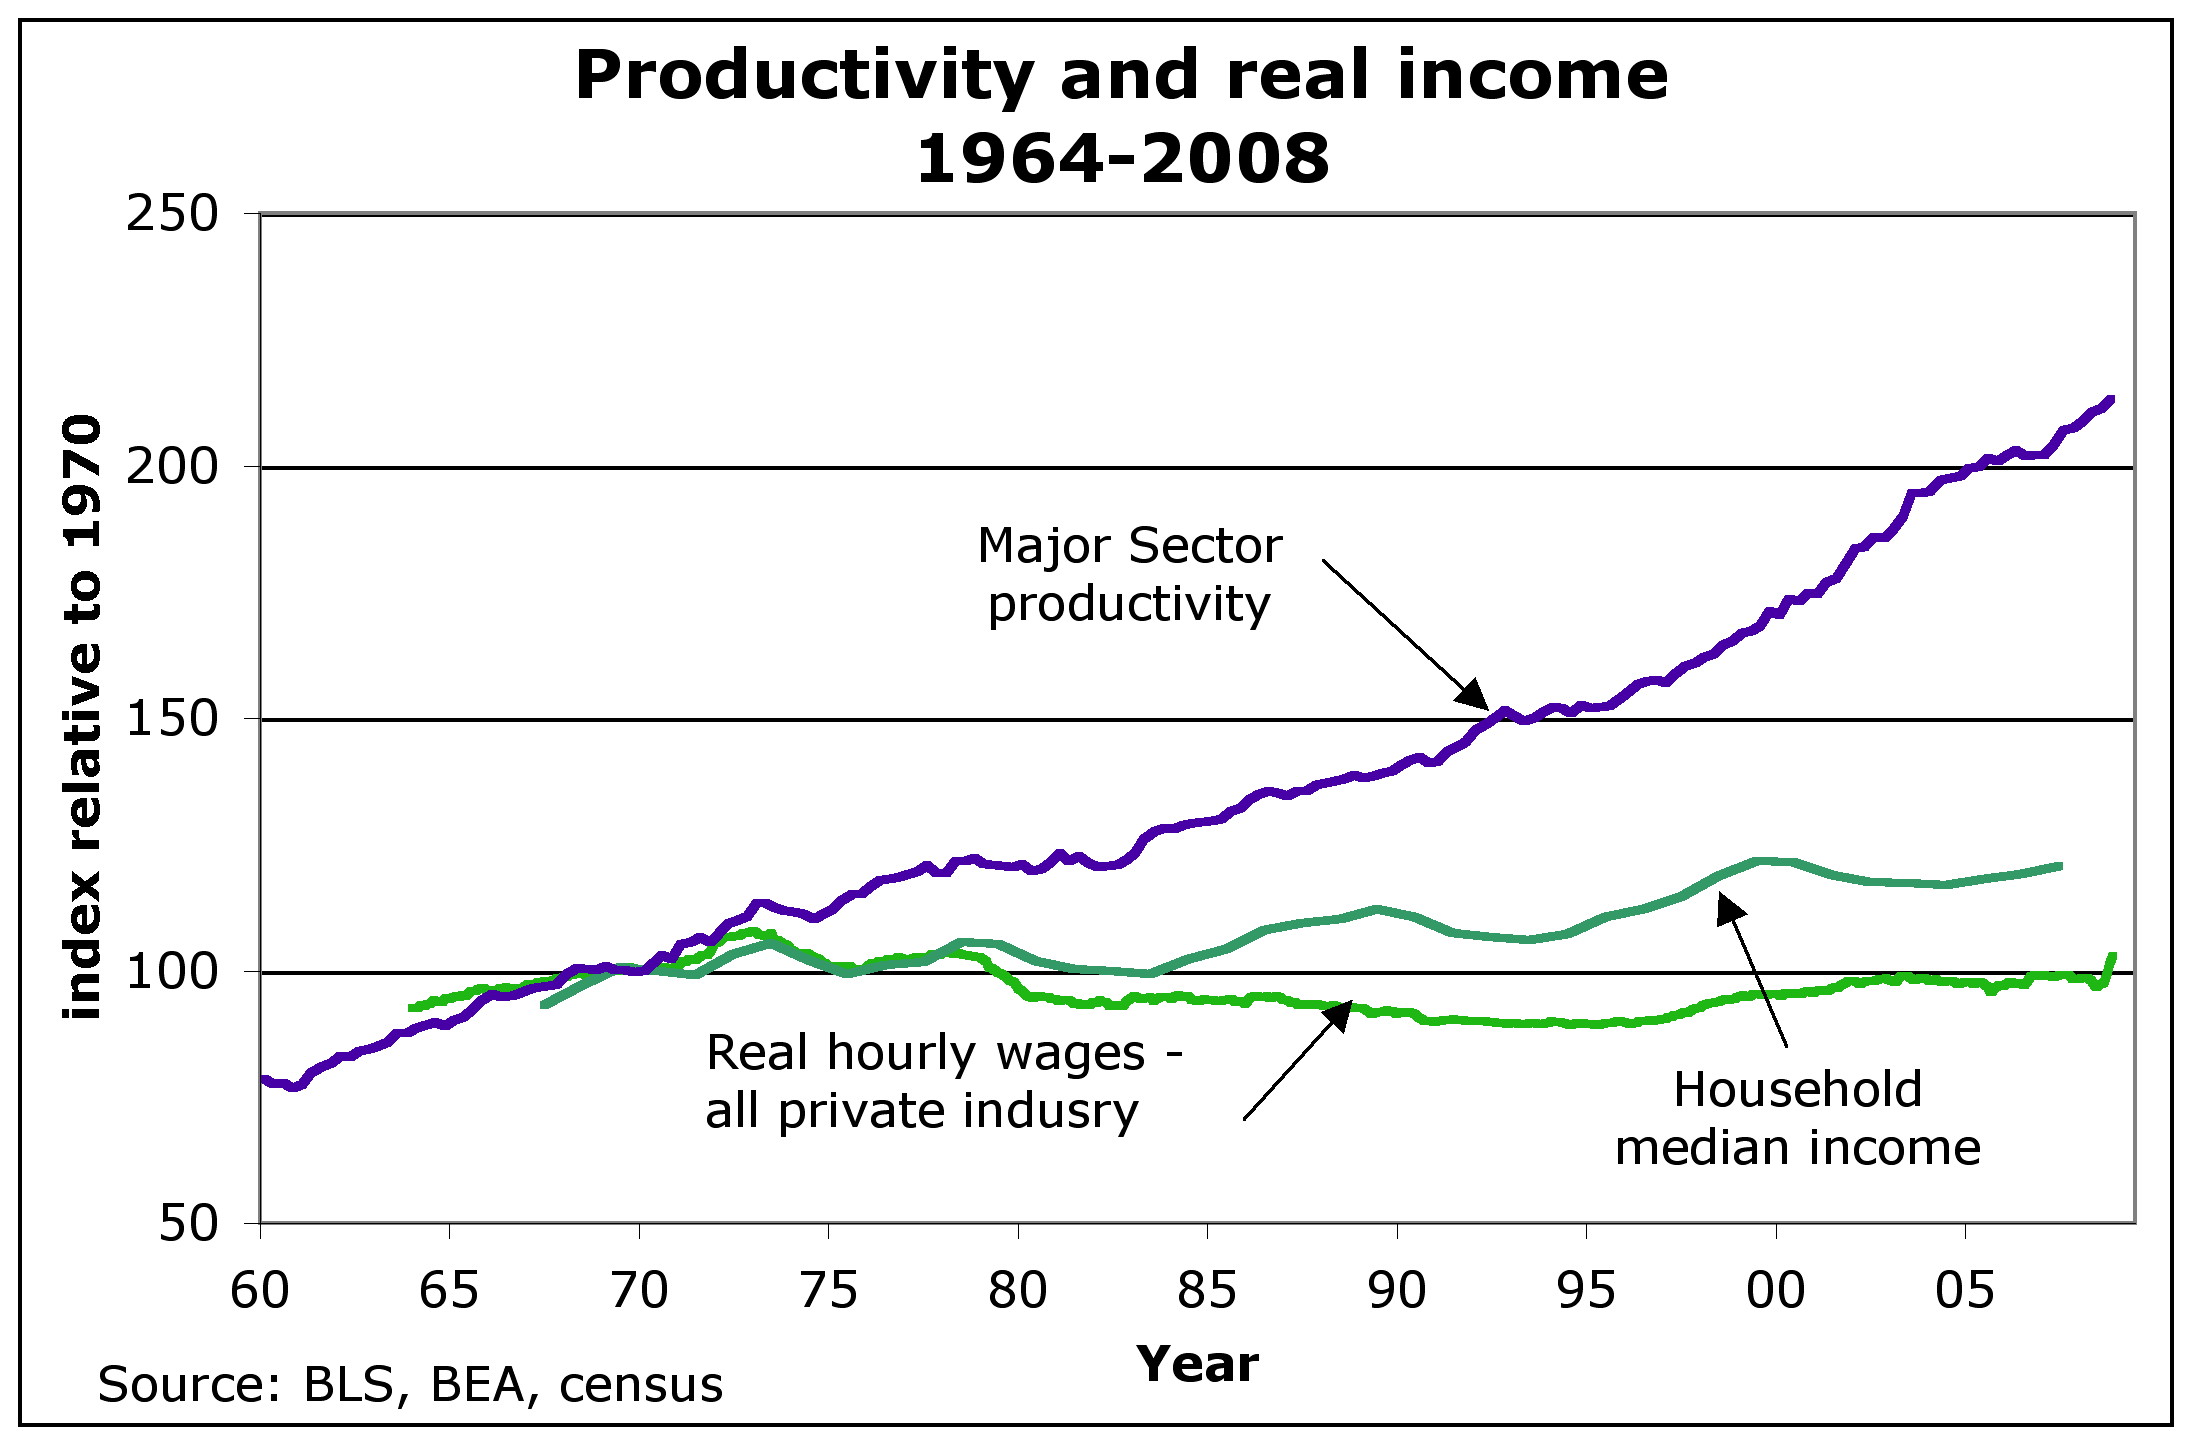
Related: About this forumMitt, thee productivity/wages graph shows the real problem.
If you bastards had not used politics to unfairly lower our wages for the past 40 years, we wouldn't be in this mess.
Eat manure and...., Mitt.
 = new reply since forum marked as read
Highlight:
NoneDon't highlight anything
5 newestHighlight 5 most recent replies
= new reply since forum marked as read
Highlight:
NoneDon't highlight anything
5 newestHighlight 5 most recent replies

mother earth
(6,002 posts)The corporate oligarchy that has f'd over this country thanks to the lack of campaign reform & unfettered deregulation hard at work.
We simply will never return to what this country supposedly stands for, until there is a return of accountability, rule of law and a gov't that serves the people.
That swinging door of lobbyists & politicians must end. We know who owns our gov't.
We all know the biggest heist ever, the true entitlement program with no other equal, is taking place before our eyes.
Thanks for the chart.
Half of the country is confused about entitlements, they are confused about the true cost of selling democracy to the highest bidder.
The other half is hoping we don't get fooled again...make it count this time, President Obama. We're coming out once again for you, because we dare not hand this country over once again to the party that brought us round two of the great depression & are steadfastly blocking any and all progress because they think mass amnesia will give them a victory.
When Adelson can save billions on his taxes by funding the Rmoney campaign, it should be speaking volumes to the "tea party", but like Santorum admits, smart people will never be their followers.

progree
(10,909 posts)Similarly please see also #28 in the below thread for corporate profits and wages as percent of economy http://www.democraticunderground.com/?com=view_post&forum=1251&pid=75268
Virtually all of the productivity gains since 1979 have flowed to the top 1% of income earners. - David Frum, Newsweek 7/2/12
The Top 1% and percent of the nation's income: 1928: 23.9%, Late 1970's: 8 to 9%, 2007: 23.5% (includes capital gains) - The Nation 7/19/10
The Newsweek 1/13/12 article by Niall Ferguson has very similar, is probably the source of the above: "According to Berkeley economist Emmanuel Saez, the share or total income going to the top 1% of families has more than doubled since 1979, from below 10% to a peak of nearly 24% in 2007 (it has since fallen, but not by much). The share going to the super-rich -- the top 0.01% -- has risen by a factor of 7."
(David Frum is the former Bush adviser or somesuch that has turned lefty in the last year or two or so. Its odd that Niall Ferguson would write about growing inequality {he wrote the Newsweek cover story hit piece on Obama 3 or so weeks ago}
Average HOUSEHOLD Income (2007 $) -- post-transfer and post-tax incomes.
[div style="display:inline; font-size:1.37em; font-family:monospace; white-space:pre;"] Year 1979 2007 %increase
[div style="display:inline; font-size:1.37em; font-family:monospace; white-space:pre;"] Top 1% (P1) 350,000 1,300,000 271.4%
[div style="display:inline; font-size:1.37em; font-family:monospace; white-space:pre;"] Mid 60% (Q2+Q3+Q4) 44,000 57,000 29.5%
[div style="display:inline; font-size:1.37em; font-family:monospace; white-space:pre;"] Bottom 20% (Q5) 15,500 17,500 12.9%
[font size=2] [2] Lane Kenworthy, using data from the Congressional Budget Office
http://lanekenworthy.net/2010/07/20/the-best-inequality-graph-updated/
http://www.cbo.gov/publications/collections/collections.cfm?collect=13 [/font]
The following is a pithy summary of much of the above for the message board wars:
[font color="blue"]In inflation-adjusted dollars -- From 1979 to 2007 the top 1% increased their income by 271% while the middle 60% increased by only 30%. Virtually all the productivity gains since 1979 has gone to the top 1%. Their share of the nation's income has increased from about 9% to 24%. [/font]
mother earth
(6,002 posts)The inequality is absolutely staggering. The backbone of this nation is being severed & gutted, with plenty of inside help, the foxes guarding the henhouse are stuffing their pockets while enabling the oligarchy & serving lobbyist dreams. REFORM had better rule the day after this election.