All About Mutual Funds. (Pardon the dust! Thread currently being renovated!)
Last edited Fri Feb 28, 2020, 12:14 AM - Edit history (13)
Please note and look for the hedging words I will use in the following like "Almost" and "Most of" etc. The old adage "There are exceptions to every rule" is true for many things, and this subject is no different. If I say Most Of for example, it means that there will be and likely are situations that are different or that a specific rule does not apply in every case. There is an awful lot of information to be learned about Mutual Funds that can help the average investor/401(k) participant, so don't be overwhelmed nor should the reader assume he must have all this down pat before he buys a fund.
I will not claim that this report will include the answer to every possible question nor will it be 100% complete, but I'll do my best to cover the most important aspects. I am going to concentrate on the basics of how they are put together, how to read a report on one and what to look for. I am sure I will miss something important, but that's what the "Reply to this thread" button is for! Please, PLEASE feel free to ask questions if you have any. There are several regulars in this group that are very knowledgeable and If I don't answer your question, one of them will I'm sure, chime in.
(For a bit more on my history and experience, please read the OP in this thread.) Substantial edits in text will be accompianied by the identifier "Ed." and will appear at the end of a paragraph.
What are Mutual Funds?
They are best described as a basket or portfolio of stocks or bonds or a combination, assembled by the portfolio manager(s) to achieve a specific purpose. This purpose can be growth of principal, income or both. This purpose is specifically spelled out in the fund prospectus. The prospectus will also spell out how much risk the fund is willing to take, how and what they invest in, sectors, countries, security types etc. Ed. There are pure Stock funds, pure Bond funds, so-called "Blended" funds which include both stocks and bonds and there are what are known as a "Fund of Funds", wherein the majority or the entirety of the Mutual Funds portfolio is made up of other Mutual Funds. Funds of this type are usually issued by a fund company and generally contain funds from that same company. Vanguard and Fidelity both offer this type, as do several other fund families.
Mutual Funds are one of the most common ways for the average investor to participate in the stock market and the bond market. The overwhelming majority of 401(k), 403(b) and 457 plans utilize them almost exclusively.
Mutual Funds (MF's from here on) do not "Trade", meaning they are not securities that change hands through an exchange, like the NYSE. MF's are issued and redeemed (Technically, you don't "sell" your shares, you request they be redeemed by the issuer) by the Mutual Fund company itself, be it Fidelity, Dodge and Cox, Vanguard, American Funds or any of the dozens of others. Each new share issued is in effect, a brand new issue of a brand new security and this is why the rules require the buyer to be provided with a prospectus. MF's hold a portfolio and that portfolio is divided up into shares of equal value (Called its "Net Asset Value" ) and those shares are then sold to investors and are held "Mutually", hence the name. In theory, whenever a new share of a MF is issued, the manager must go into the market and purchase the correlating number of shares of each and every stock and/or bond the fund holds in order to issue a new share of the fund. That doesn't necessarily happen when you buy a few dollars worth with your weekly 401(k) contribution, but it certainly happens if you were say - a large investor or the manager of a Pension Fund buying ten million dollars worth at once. The fund manager must do this so as not to dilute the value of shares currently held.
All MF's have a 5 letter "ticker" that ALWAYS ends in the letter "X". If someone tells you they have a Mutual Fund and give you a 3 letter ticker, that is an "Exchange Traded Fund" (ETF) or a "Closed End Fund" (CEF) which are similar to a MF's but with several fundamental differences.
Mutual funds are considered "Open End Funds" meaning there is no theoretical limit to how many shares can be issued. They are often referred to as "Open End Mutual Funds" to avoid confusion with "Exchange Traded Funds" (ETF's) and "Closed End Funds" (CEF's), both of which have a specified number of shares issued and trade on an exchange.
MF's are issued in various classes of shares, denominated by the letters "A", "B", "C", "F" and "I". F and I shares are Institutional shares, their purchase restricted to managers of Insurance companies and Pension Plans, among others. A,B & C are the most common held by individuals. The website "Investopedia" has a good write up on share classes and their differences and can be found here
Briefly described as follows;
"A" Shares
A shares typically charge an up-front fee to purchase, called a "Front-end load" or "Front loaded fund". This fee can vary by fund family from somewhat high to zero, and typically decreases as the initial purchase goes up. They have the lowest ongoing management fees and are therefore the cheapest to own over the long term. A shares are best used when the investor is planning on holding the fund for an extended period, say 5 years or longer.
"B" Shares
B shares have no front load but have a fee to redeem them, called a "Contingent Deferred Sales Charge" or CDSC, that is charged on a sliding scale that gets lower the longer you hold them, typically ending in zero after 5 years but some as long as eight years, depending on the fund family and/or the fund itself. B shares will also convert to A shares after a specific length of time. B shares tend to have the highest ongoing management fees. Some fund families have done away with offering B shares completely because the feeling is they are a ripoff (which they are, in my opinion), American Funds being one of them.
"C" Shares
C shares also have no front load and a CDSC that lasts for only one year. C shares are suitable for individuals that plan on holding a fund for a shorter period.
"No Load"
Mutual Funds that have no up front charge or CDSC. There are some limitations or restrictions on No Load funds that are not applicable to loaded funds, including higher purchase minimums, some as high as $10,000, as well as very limited guidance provided by the fund company.
---------------------------------------------------------------------------------------------------------------------------
The best way to describe them as well as illustrate what to look for is to view a report of a sample fund. For the purposes of this illustration, I am going to use a MF I am familiar with and that I personally own: American Funds, Growth Fund of America, ticker AGTHX. AGTHX is one of the, if not THE largest equity based MF in existence by assets under management. If it isn't currently, it held that distinction for years. Disclaimer I am in NO WAY recommending this particular fund for purchase, nor am I recommending it as a suitable investment for all or any particular individuals.
This report and similar reports of any MF you care to look at can be found on the Morningstar website at www.morningstar.com The easiest way to search that site for a fund is with the 5 letter ticker. If you don't know the ticker for a fund you wish to search, just Google the entire name of the fund and you can find the ticker that way.
Morningstar is probably the largest and certainly the most commonly used information service provider for MF's in the securities industry.
So let's take a look at the report pages for AGTHX. If you type in the ticker at the top of the Morningstar page in the box next to "Quote" the following page will appear;
------------------------------------------------------------------------------------------------------------------------------
At the very top of the page you will find the entire, proper name for the fund, its share "Class", in this case "A", the ticker and Morningstar's rating for the fund out of 5 stars. Below that is a line of links to the various pages of the report. This one is "Quote". Below that line is, from left to right, the "NAV" or "Net Asset Value" of the fund, which is its share price as of the end of the previous trading session and how much it changed either up or down as a percentage. It should be noted that MF share prices are calculated once a day, at the end of the trading session. Their price does not change during trading hours. Next to that you will see headings for the following;
Total Assets:
The amount in Billions the fund has under management.
Adj. Expense Ratio
Adjusted Expense Ratio. This item has a small "i" in a circle, and when clicked on says the following;
Adjusted Expense Ratio excludes certain variable investment-related expenses, such as interest from borrowings and dividends on borrowed securities, allowing for more consistent cost comparisons across funds.
Expense Ratio
If this fund was heavily leveraged and/or did a substantial amount of borrowing or lending shares, this figure would be somewhat different from the previous.
Fee Level;
Morningstars assessment of the fees charged for this fund by the fund family. In this case "Low".
Load;
The amount of the front load charged (if any) as a percentage of the total amount of the initial purchase. In this case it is 5.75%
The next line down begins with
Category
The category Morningstar places this fund in. This is a large-cap Growth fund made up of primarily US companies.
Investment Style;
The style of investing used by the management, meaning what they purchase and how it fits in the fund. It also displays a "Style Box" (I'll get into that in a bit) showing a black mark in the upper right corner.
Minimum Initial Investment;
The minimum dollar amount required to buy shares, in this case $250.00
Status;
Whether the fund is open or closed to new investor purchases. In this case, the fund is "Open".
SEC Yield
The total yield of the funds holdings, as a percentage. In this case it is .34% which in real terms means a position of one million dollars in this fund would pay $3400 per year in combined dividends and interest. That figure can and will change as securities are bought in and sold out of the fund.
Turnover;
The amount of turnover of the portfolio for the last year as a percentage. In this case 36% which means the management team sold and replaced with other stocks or bonds, thirty six percent of the portfolio in the last 12 months.

In the section above titled "Morningstar's Analysis" there is a pair of "radio buttons", the highlighted one shown in the shot above being the "Analyst Take" which only gives you a sentence or two. In order to see the rest, a subscription is required. This is typical of many financial information services on the internet - they want you to pay to read their opinions! The other button says "Investment Objective" and here is that text;
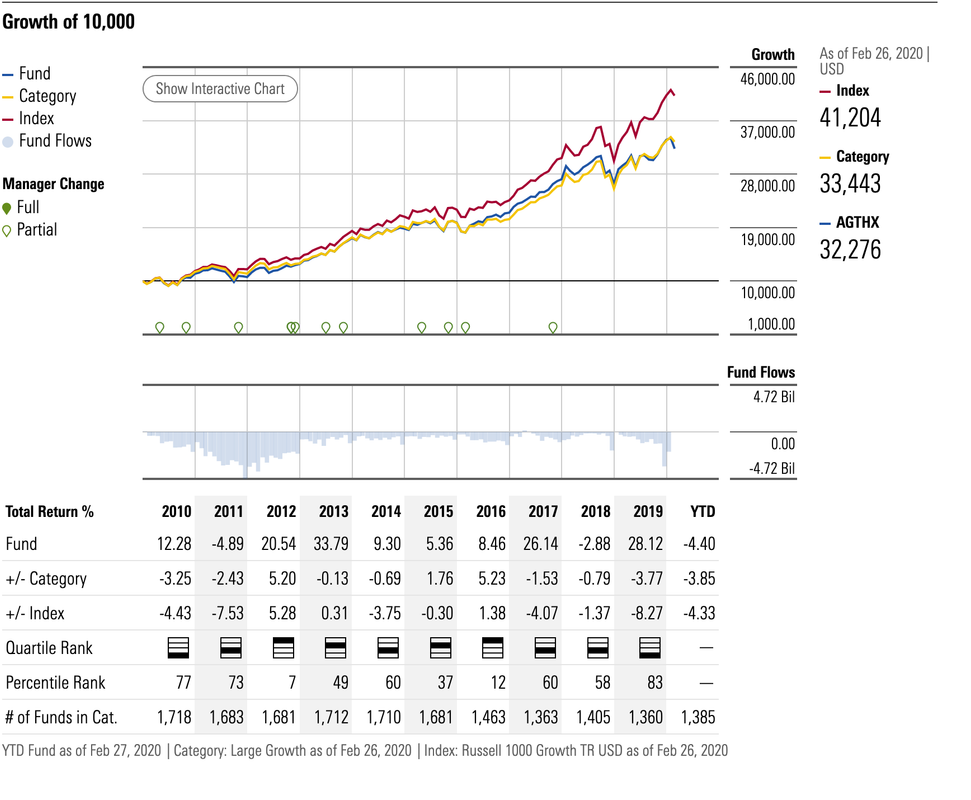
Under all of that appears a "Growth of 10K" chart, known as a "Mountain Chart" for obvious reasons. This is typical of MF reports and shows how much an investment of $10,000 made ten years ago would have grown or decreased. It also displays trend lines for one or more "Benchmark" indexes, in this case there are two - the Russell 1000 Growth TR (The "TR" stands for "trust" meaning they are using as a benchmark a trust account of Russell 1000 issues) and the "Category". The category is an average for all the other funds in the mutual fund universe that fall into the same category as this one. Notice that in this case, the fund and the category as a whole underperformed the Russell 1000 index. (Note: Before this major update and edit, the Index used was the S&P 500 and the fund had outperformed that index for the previous 10 years. Since I wrote the original Post, Morningstar changed the comparison index.) If you had placed ten grand in this fund in 2010, it would be worth $32,276 today. These figures are ALWAYS calculated using "total return" which means reinvesting any dividends, interest (if any) and capital gains by buying more shares as time goes on.
Directly below the chart is a table of data that expands on the information the chart is providing. Note that the columns below correspond to the years of the chart, so that for the year 2015 as an example, you can see that the fund had a return of 5.36%, and that was 1.76% BETTER than the category average but 0.30% WORSE than the index. That information is then shown in the "Quartile Rank" (Note 2010 and 2019 where it was at the bottom and 2012 and 2016 where it was at the top) and below that "Percentile Rank" where a lower number represents better performance. The bottom line is "Number of Funds in Category". Note how that number swings rather substantially. There were 355 more Large Cap Growth Mutual Funds in 2010 than there were in 2017. This can happen for a few reasons, one of which is called "Style Drift" where the managers change their investment strategy and divest from large, mega-cap companies, for instance. They can come and go from a particular category depending on what the portfolio is made up of. BTW, None of this sort of thing is done in the dark. If you owned a Mutual Fund that went from being a Large Cap Growth fund to a Mid Cap Value fund, the fund would have sent you an addendum to the prospectus. If the original prospectus indicates such changes may take place, if and when they do, they are typically made known to the shareholders.
*****TEXT FROM HERE DOWN IS AWAITING UPDATES AND RENOVATION. PLEASE BEAR WITH ME!******
This page expands on some of the information given above. The first section again compares this fund to the R/1000 Trust as well as the fund category over the indicated time frames. It also shows the plus or minus comparison to the R/1000 and the category. A number with no notation indicates it outperformed and a minus in front of the figure means it underperformed and those figures are in percentages. Ed. Clarification: The first 3 lines of this section describe how much of a gain or loss the fund, the benchmark and the category experienced, expressed as a percentage. The following two lines show that relationship as a percentage to the two comparative benchmarks. Looking closer for the year 2008 for instance, the fund was down 39.07%, the S&P Trust was down 37% and the category was down 40.67%. The difference is shown in the lines below and clarify that the fund was down 2.07% MORE than the S&P but performed BETTER than the category by 1.60%
The section directly under the Mountain chart is a table of data that expands on the information in the mountain chart. The first line says "Growth of $10,000" and has the dollar figures for "YTD" (Year To Date), 1 month, 1 year etc. to ten years. Again, these figures assume investing $10,000 and reinvesting all dividends, interest and capital gains for the time period indicated. Under that is displayed that same growth as a percentage on an annual basis. So for the YTD figure, the fund has realized 5.65 if carried out to a full year. The remaining categories are the same as above, out to ten years. Below that it says "+/- S&P 500 TR" which tells you how much, more or less, the fund performed measured against the S&P 500 trust benchmark by percentage. You can see that it has underperformed the S&P for every time frame except the ten year, where it has beaten it by 1.02% The next line says "+/- Category" which shows how this particular fund performed against an average of all the other funds in the same category, similar to the growth chart and again, as a percentage. So this line shows the fund underperformed the category in all but two time frames: the one year and ten year. Next is "% Rank in Cat". This shows where as a percent the fund ranks weighed against all the other funds, the lower the number, the higher it ranks. You can see that its highest rating is the ten year column. Last in this section is "# of Funds in Cat". That changes as time goes on because the total number of funds listed in the category varies as some funds may fall out of the category, others may may enter the category or other factors, such as the fund closing completely or new ones offered.
Below that is the section titled "Top Holdings". This is pretty self explanatory, as it shows the top 5 positions the fund holds, how much of a percentage of the funds assets they represent, what the last share price of the issue was, the percentage change in price during the last trading session and its 52 week range. In this case the largest position they hold is in shares of Amazon, which represents 3.91% of the entire portfolio.
Next is "Top Sectors". Of all the various sectors of the economy and their correlating stocks, this section shows the top five held by the fund. They heaviest weighting is currently in Health care stocks, representing 17.37% of the entire portfolio.
(For a list of the recognized sectors and sub sectors, see this Wikipedia entry.)
Finally the last section on the left is "Dividends and Capital Gains Distributions". This section shows how much was distributed per share, the date and for how much. The first column is the date the distribution occurred. Next is "Distribution NAV", the share price on the date of the distribution. Next to that is "Long Term Capital Gain", then "Short Term Capital Gain" and "Return of Capital". These all refer to an instance where the fund manager might have sold a stock position for more than they paid for it. Long term is a position held for longer than one year, short term for less than one year and Return of Capital refers to any money resulting from the sale of the shares distributed to shareholders. In this case all of the columns read 0.000 meaning they sold no positions resulting in gains. Next is "Dividend Income". This shows the amount in cents per share distributed to shareholders. This is an aggregate amount from all of the dividend paying positions the fund holds.
At the top and to the right of that column is a pie chart showing the "Asset Allocation" of the fund.

The "Performance Tab".
This page an exact copy of the mountain chart and the data table shown above on the "Quote" tab, with the addition of the table shown below. The first section again compares this fund to the R/1000 Trust as well as the fund category over the indicated time frames. It also shows the plus or minus comparison to the R/1000 and the category. A number with no notation indicates it outperformed and a minus in front of the figure means it underperformed and those figures are in percentages. Ed. Clarification: The first 3 lines of this section describe how much of a gain or loss the fund, the benchmark and the category experienced, expressed as a percentage. The following two lines show that relationship as a percentage to the two comparative benchmarks. Looking closer for the year 2008 for instance, the fund was down 39.07%, the S&P Trust was down 37% and the category was down 40.67%. The difference is shown in the lines below and clarify that the fund was down 2.07% MORE than the S&P but performed BETTER than the category by 1.60%

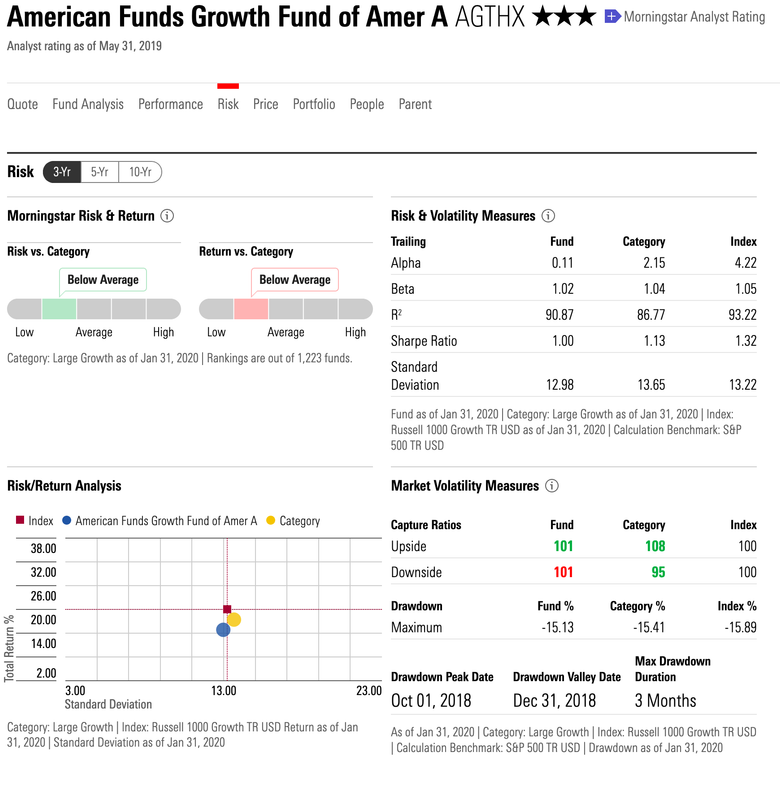
The "Risk" tab.
This information can help you assess whether a fund fits into your portfolio as well as showing pertinent figures derived from "Modern Portfolio Theory" calculations. The first section describes Morningstars assessment of this fund. The second deals with the MPT statistics. Of these, one of the most important in my opinion is "Alpha". Alpha is a measure of performance against a benchmark index, in this case the Russell 1000. A positive Alpha means it outperformed the market and a negative means it underperformed. In a Bull market, a high Alpha is desired and in Bear markets a negative Alpha is best. An Alpha of zero would mean the funds price would rise or fall in exact correlation with the benchmark.
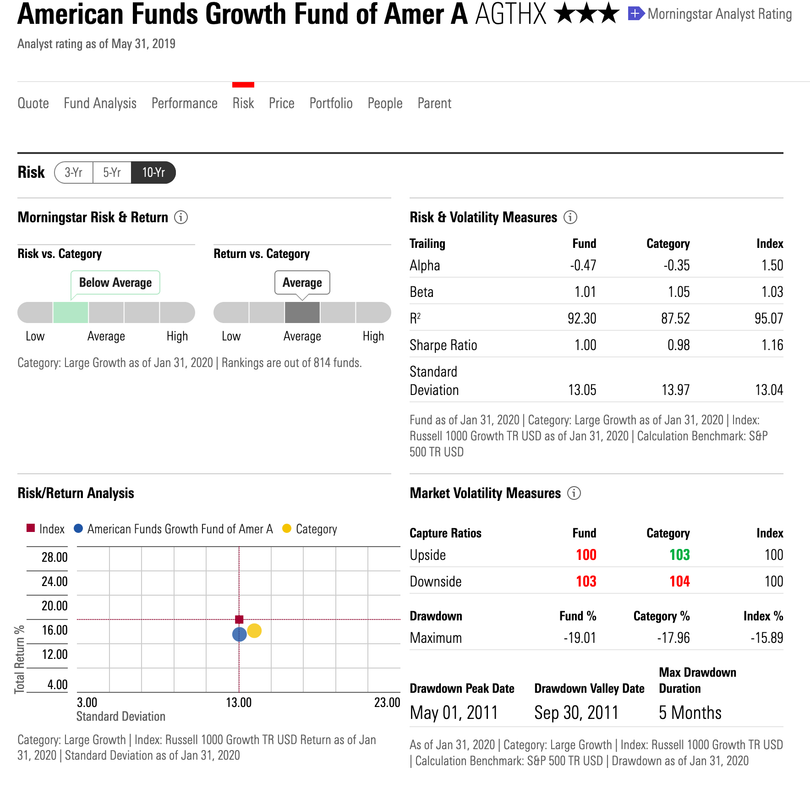
This picture shows the "10-Yr" radio button highlighted showing the differences between the two timeframes.
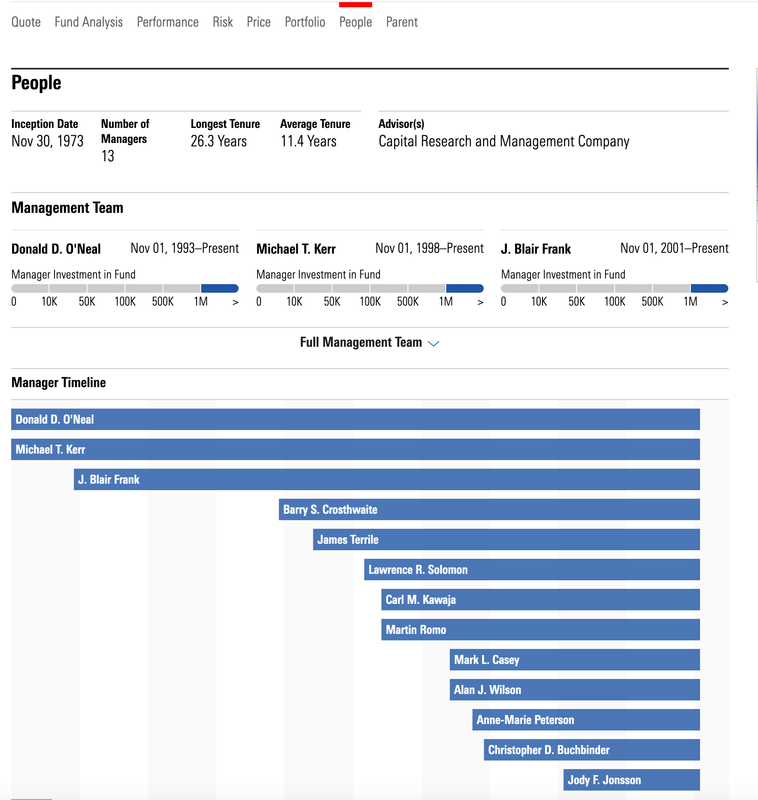
The "People" tab gives more detail on the stewards of the fund.
The "Portfolio" tab. This page gives much more detail on the stocks or bonds the fund holds. Once again there is a pie chart showing asset breakdown. This fund is overwhelmingly US Companies (74.2%) For a full list of the issues held by a particular MF, you would have to go to the fund companies website and look up the Annual Report for the fund or the Proxy Statement, if any.
The section below describes the "Style Details" of the fund. The Style defines the type of stocks or bonds and/or the geographical distribution of the issues held. This fund is a US Large Cap fund. Other style types can include Small Cap Emerging Markets or Mid-Cap Europe or California High Yield Bond for instance. There are dozens of such styles.
On the right is the "Style Box" This is a very common illustration that will show how the funds style is categorized. The box is made up of 9 squares. For Stock funds, from top to bottom the boxes represent Large Cap companies, then Mid Cap and Small Cap. From left to right the columns represent Value, Blend and Growth. These terms relate to the individual issues and whether they are determined to be Growth Stocks, Value Stocks or a blend. The numbers inside the boxes are percentages of the fund and will always total 100. In this case, 56% of the stocks held by the fund qualify as "Large Cap Growth" issues.
The "Ownership Zone" box is similar to the Style Box but shows distribution of the shares held. It is expanded slightly to include "Giant" and "Micro" referring to the types of companies as well as "Deep Value" and "High Growth". You can see the dot in the shaded area is at the far upper right and is the Weighted Average of Holdings. Note the shaded area extends only to the middle of the "Core Value" box and just to the top of the "Medium Growth" boxes. This covers all the issues the fund holds. In other words, they don't own any stocks that could be considered "Micro Cap Deep Value".
Below that is a section titled "Investment Style History". This will show if the fund has experienced what is known as "Style Drift" where a fund may change from being a large cap growth to a mid cap value fund, for instance. The Small style boxes in this example are all blacked in at the upper right, indicating they have had no drift over the time frame indicated.
To the left of that section, more information on the portfolio's Value and Growth measures is provided, including the average Price to Book ratio, the Dividend Yield and Historical Earnings.
Below that appears more detail on the Sector Weightings of the fund. Where the first page above shows just the top sector weightings, this section shows all of the sectors and how they are represented by the fund at the same time comparing it to the benchmark and the category.
And finally the "World Regions" section. This shows where geographically the fund invests. Again, this is primarily a North American Stock Fund.


Those are the most important points on one of these reports. Morningstar does provide more information to subscribers and the tabs "Fund Analysis" and "Stewardship" are subscriber only tabs.
Once again, I know this is not a complete dissertation on all possible aspects of Mutual Funds, but I hope it has given the reader some insight as to how to read these reports. Anyone that has a 401(k) and has received information on the funds available, will have at least glanced at the first page of one of these reports.
 = new reply since forum marked as read
Highlight:
NoneDon't highlight anything
5 newestHighlight 5 most recent replies
= new reply since forum marked as read
Highlight:
NoneDon't highlight anything
5 newestHighlight 5 most recent replies

elleng
(130,903 posts)I wanted to send a friend some similar info.


A HERETIC I AM
(24,368 posts)Whew! Started working on this 2 weeks ago! Finally.
Glad you can use it.
elleng
(130,903 posts)No wonder it took 2 weeks.
THANKS again.

Common Sense Party
(14,139 posts)...but I'm gonna have to wait. Until tomorrow.
The screen grabs look nice.
A HERETIC I AM
(24,368 posts)More than happy to cut and paste text of your own and make the notation that it is your entry - to give credit where credit is due. Just PM me if you have something to add.
I'm really glad the Admins extended the edit feature indefinitely!
Hope you're well.
Common Sense Party
(14,139 posts)ranking?
I remember back in the day, some people would ONLY invest in 4- and 5-star funds, thinking that was the easy way to wealth.
A HERETIC I AM
(24,368 posts)And AGTHX has gotten beat up pretty bad over the last few years, primarily because of the rather conservative investment style they have traditionally stuck with. It's averaged just under 2% per year for the last 5 years.
(Edited a sentence out because it was not accurate)
BTW, and you may know this, CSP, Morningstar gives annual returns rankings for "Since Inception" (of the fund, meaning from the date it was launched) only on their advisor site. If you go to The American Funds website and look at the "Returns and Expenses" page for AGTHX, it shows "Fund Lifetime" returns. 13.29% average annual return net of fees. Launched December 1st, 1973.
Most fund family pages will give similar info for their funds, but not Morningstar on their public pages for some reason.
Many, MANY 5 star funds tank the next year! I remember looking at one in late 2006 - a MBS backed bond fund rated 5 stars at the time that just blew up in 2007 through '08. 14 months later it had 1 star!
Here's a link to their rating methodology page;
http://corporate.morningstar.com/US/documents/MethodologyDocuments/FactSheets/MorningstarRatingForFunds_FactSheet.pdf
Common Sense Party
(14,139 posts)which was way too short. It looks like they're now looking at 3, 5 and 10-year performance, so that does make me feel better.
But you're right (I was asking more as devil's advocate), this year's "hot" 5-star fund can be a two-star dog in a year or two.
Was Munder NetNet a five-star back in 1999?
A HERETIC I AM
(24,368 posts)LOL...no doubt!
A HERETIC I AM
(24,368 posts)Response to A HERETIC I AM (Original post)
Name removed Message auto-removed
BCBacon
(11 posts)I was hoping to put something like this together for a friend, but you saved me the trouble! 
A HERETIC I AM
(24,368 posts)
fleabiscuit
(4,542 posts)A HERETIC I AM
(24,368 posts) 
Dark n Stormy Knight
(9,760 posts) A HERETIC I AM
(24,368 posts)Fucking Photobucket absolutely SUCKS compared to how it used to be, and I have dozens of photos in threads on DU that are hotlinked from there that I have to update.
I have a several threads in the Cooking and Baking group that look the same way.
The process is tedious as hell, though. First I have to download them back to my desktop, one at a time, because some of them are so old, I deleted them long ago, or they were put up using an old Windows unit and I now have a Mac.
After downloading them, I have to upload them to another service, and I've been using PostImage which works well, but then edit the thread and enter the new URL. Doing the shots for that one thread will probably take me the better part of a couple hours, and - again, I apologize, - I am one of the worlds premier procrastinators!
I appreciate that the thread still gathers eyeballs, and I'll try and get it sorted out in the next couple of days.
A HERETIC I AM
(24,368 posts)at new data, and they have changed their website to subscription only! Fuckers!...
This still is going to be a while because fucking Photobucket keeps giving me these popups trying to solicit money for their shitty website.
I have to make sure I recapture all the images before fucking Photobucket locks me out completely, so have patience. If I can get new data from Morningstar, I will. The original OP took me several days to write and compile.
Dark n Stormy Knight
(9,760 posts)& finance, and probably need something far more basic than your tutorial. But, with wild & baseless optimism that I may some day be up to getting something from it, I just thought I'd express my interest.
It's a shame about the image difficulties. I haven't been on DU much lately, but for a while was posting some of my photos in the photo group here, but it was always such a pain to get them in a post, I was discouraged. I use Flickr, and it could be worse, but it also could be better. I guess it would cost DU too much to host images directly. (Maybe I understand economics well enough to get that right?)
Anyway, thanks for your work in the first place and your willingness to reinvigorate the post when you can.

A HERETIC I AM
(24,368 posts)and now have to upload them to Postimage.
They have revamped the way they present some of the data and have added new information, such as the Carbon Footprint of the fund, which is new since I last looked at their fund pages.
It will require some re-wording of the entire text to make sense of the new screenshots, but it's all in a days work!
It needed redoing at any rate, as you can see the original post was put up almost 7 years ago! My, how time flies.
I'll change the name of the thread to "Under Construction" or something silly, but when you see it has changed back to "Revised" or something, you'll know it's finished.
Again thanks for your interest, and please, PLEASE don't be bashful if you have questions about ANYTHING related to the topic of this group. There are a bunch of very knowledgeable people who read this group regularly and are very capable of giving you answers to questions.
Dark n Stormy Knight
(9,760 posts)I'll bet other DUers will benefit from the update of your post as well.
And thanks for the encouragement. I hope I can find the time, energy, & patience to persevere in educating myself at least a little on this topic! I see that the question I posted yesterday to General Discussion (which you and some others from this group have kindly respond to) would have been more appropriate here, so I'll know in the future.