Welcome to DU!
The truly grassroots left-of-center political community where regular people, not algorithms, drive the discussions and set the standards.
Join the community:
Create a free account
Support DU (and get rid of ads!):
Become a Star Member
Latest Breaking News
General Discussion
The DU Lounge
All Forums
Issue Forums
Culture Forums
Alliance Forums
Region Forums
Support Forums
Help & Search
Environment & Energy
Related: About this forum
InfoView thread info, including edit history
TrashPut this thread in your Trash Can (My DU » Trash Can)
BookmarkAdd this thread to your Bookmarks (My DU » Bookmarks)
12 replies, 1177 views
ShareGet links to this post and/or share on social media
AlertAlert this post for a rule violation
PowersThere are no powers you can use on this post
EditCannot edit other people's posts
ReplyReply to this post
EditCannot edit other people's posts
Rec (8)
ReplyReply to this post
12 replies
 = new reply since forum marked as read
Highlight:
NoneDon't highlight anything
5 newestHighlight 5 most recent replies
= new reply since forum marked as read
Highlight:
NoneDon't highlight anything
5 newestHighlight 5 most recent replies
= new reply since forum marked as read
Highlight:
NoneDon't highlight anything
5 newestHighlight 5 most recent replies
OMGWTFBBQ (Original Post)
XemaSab
May 2016
OP

AuntPatsy
(9,904 posts)1. I have no idea what it is intended to mean?
GliderGuider
(21,088 posts)9. OMG!!! WTF??? The ice cap is getting BBQed!!!
Or some approximation thereof.
AuntPatsy
(9,904 posts)10. I meant the graft, wasn't able to understand it, well aware of melting ice
GliderGuider
(21,088 posts)11. Ah, OK!

hatrack
(59,587 posts)2. Uh . . . interesting graph - it does kinda grab one's attention OFHWAD!!!


XemaSab
(60,212 posts)3. I really wish the satellite was recording this
I know I've said this every year for the last 9 years, but this could go all the way.
muriel_volestrangler
(101,322 posts)4. As their main page says, that satellite is broken
Special Sensor Microwave Imager and Sounder (SSMIS) on the Defense Meteorological Satellite Program (DMSP) F-17 satellite that provides passive microwave brightness temperatures (and derived Arctic and Antarctic sea ice products) has been providing spurious data since beginning of April. Working on resolving problem or replacing this data source.
http://arctic.atmos.uiuc.edu/cryosphere/
http://arctic.atmos.uiuc.edu/cryosphere/
I put a link to the Japanese ice extent data, which is still working (but not directly compatible with the F-17 extent/area results, so it's not just a simple switch) in the E&E pocket reference guide on Monday: http://www.democraticunderground.com/?com=view_post&forum=1127&pid=100902
https://ads.nipr.ac.jp/vishop/vishop-extent.html
Today (slight close-up to before and after the maximum and minimum):

hatrack
(59,587 posts)7. And we certainly can't pay to send up a new satellite!
That would be wasteful government spending!

muriel_volestrangler
(101,322 posts)8. Yeah, the Republicans blocked what would have been F20
See http://www.democraticunderground.com/1127100573
They do have F16 and F18, which they are going to be able to set up in some way:
Sea Ice Index processing uses an NSIDC NASA DAAC product, Near-Real-Time DMSP SSMIS Daily Polar Gridded Sea Ice Concentrations (NSIDC-0081), as input. The NSIDC DAAC has started the work needed to move to a new source for NSIDC-0081. This involves retrieving F18 and F16 satellite brightness temperatures from our data providers and then implementing parallel processing for ice concentration to determine which satellite will be best suited to continue the time series. The satellite selected will be the primary replacement for F17, but should that satellite fail, we will be able to switch to the other one without a service interruption.
https://nsidc.org/the-drift/data-update/sea-ice-index-processing-suspended/
https://nsidc.org/the-drift/data-update/sea-ice-index-processing-suspended/
muriel_volestrangler
(101,322 posts)12. update: NSIDC has started using the F18 data provisionally
though the 'Cryosphere Today' data in the OP is not yet using that.
NSIDC has obtained data from the DMSP F-18 satellite and is in the process of intercalibrating the F-18 data with F-17 data. Intercalibration addresses differences between the series of sensors, in order to provide a long-term, consistent sea ice record. While this work continues, we are displaying the uncalibrated F-18 data in the daily extent image. The daily time series graph shows F-17 data through March 31, and F-18 data from April 1 forward. Initial evaluation of the uncalibrated F-18 data indicates reasonable agreement with F-17, but the data should be considered provisional and quantitative comparisons with other data should not be done at this time.
Because these are provisional data, the Sea Ice Index has not been updated and continues to display only F-17 data through March 31. We expect to make the F-18 data available in Charctic soon.
http://nsidc.org/arcticseaicenews/2016/05/daily-sea-ice-extent-updates-resume-with-provisional-data/
Because these are provisional data, the Sea Ice Index has not been updated and continues to display only F-17 data through March 31. We expect to make the F-18 data available in Charctic soon.
http://nsidc.org/arcticseaicenews/2016/05/daily-sea-ice-extent-updates-resume-with-provisional-data/
tk2kewl
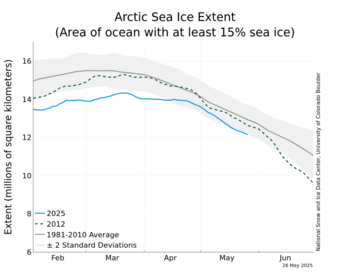
(18,133 posts)5. i like that you can turn individual years on/off
first year 1979 low ice: 5.4 million sq km
worst year 2012 low ice: 2.2 million sq km (60% less ice)
2016 trending lower than 2012