Environment & Energy
Related: About this forumNSIDC - Arctic & Antarctic Sea Ice Levels At Record Lows Every Day In December
Sea ice in the Arctic and the Antarctic set record low extents every day in December, continuing the pattern that began in November. Warm atmospheric conditions persisted over the Arctic Ocean, notably in the far northern Atlantic and the northern Bering Sea. Air temperatures near the Antarctic sea ice edge were near average. For the year 2016, sea ice extent in both polar regions was at levels well below what is typical of the past several decades.
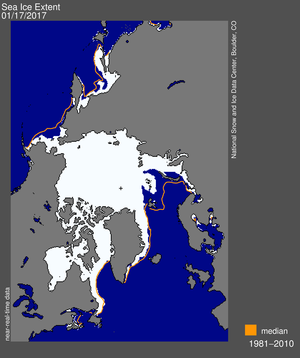
Figure 1. Arctic sea ice extent for December 2016 was 12.10 million square kilometers (4.67 million square miles). The magenta line shows the 1981 to 2010 median extent for that month. The black cross indicates the geographic North Pole. Sea Ice Index data. About the data
Arctic sea ice extent for December 2016 averaged 12.10 million square kilometers (4.67 million square miles), the second lowest December extent in the satellite record. This is 20,000 square kilometers (7,700 square miles) above December 2010, the lowest December extent, and 1.03 million square kilometers (397,700 square miles) below the December 1981 to 2010 long-term average.
The rate of ice growth for December was 90,000 square kilometers (34,700 square miles) per day. This is faster than the long-term average of 64,100 square kilometers (24,700 square miles) per day. As a result, extent for December was not as far below average as was the case in November. Ice growth for December occurred primarily within the Chukchi Sea, Kara Sea, and Hudson Bay—areas that experienced a late seasonal freeze-up. Compared to the record low for the month set in 2010, sea ice for December 2016 was less extensive in the Kara, Barents, and East Greenland Seas, and more extensive in Baffin and Hudson Bays.
Conditions in context
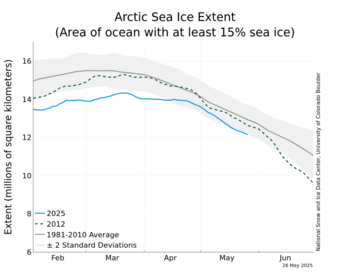
Figure 2a. The graph above shows Arctic sea ice extent as of January 2, 2017, along with daily ice extent data for four previous years. 2016 to 2017 is shown in blue, 2015 to 2016 in green, 2014 to 2015 in orange, 2013 to 2014 in brown, and 2012 to 2013 in purple. The 1981 to 2010 average is in dark gray. The gray area around the average line shows the two standard deviation range of the data. Sea Ice Index data.
Air temperatures at the 925 hPa level (approximately 2,500 feet above sea level) were more than 3 degrees Celsius (5 degrees Fahrenheit) above the 1981 to 2010 average over the central Arctic Ocean and northern Barents Sea, and as much as 5 degrees Celsius (9 degrees Fahrenheit) above average over the Chukchi Sea. Repeated warm air intrusions occurred over the Chukchi and Barents Seas, continuing the pattern seen in November.
In contrast, central Russia and northern British Columbia experienced temperatures 3 to 5 degrees Celsius (5 to 9 degrees Fahrenheit) below average (Figure 2b). Atmospheric circulation over the Arctic in December was characterized by a broad area of lower-than-average pressure over Greenland and the North Pole, extending across the Arctic Ocean to eastern Siberia, and another region of low pressure over the Ural Mountains. Higher-than-average pressure dominated Europe and the Gulf of Alaska. This set up the very warm southerly winds from both the northern North Atlantic and the Bering Strait areas, pushing Arctic air temperatures to unusually high levels for brief periods in early December and near Christmas.
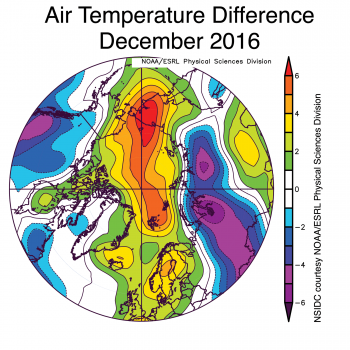
Figure 2b. This plot shows air temperature difference from average for December 2016. Air temperatures at the 925 hPa level (approximately 2,500 feet above sea level) were more than 3 degrees Celsius (5 degrees Fahrenheit) above the 1981 to 2010 average over the central Arctic Ocean and northern Barents Sea, and as much as 5 degrees Celsius (9 degrees Fahrenheit) above average over the Chukchi Sea.
December 2016 compared to previous years
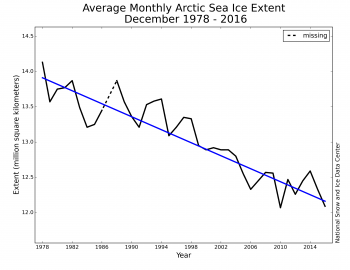
Figure 3. Monthly December ice extent for 1979 to 2016 shows a decline of 3.4 percent per decade.
Through 2016, the linear rate of decline for December is 44,500 square kilometers (17,200 square miles) per year, or 3.4 percent per decade.
While daily extents for December 2016 were at record lows, based on the method employed by NSIDC, the monthly average extent for December 2016 was slightly higher than that recorded for December 2010, the record low December in the satellite record. The monthly average extent for the month of December is higher than the month’s average of daily extents because of the way in which the Sea Ice Index algorithm calculates the monthly extent. The algorithm calculates the monthly average total extent from the monthly average gridded concentration field. Thus, when sea ice is retreating or advancing at a high rate over the course of the month, as was the case for December 2016, the Sea Ice Index monthly average can yield a larger extent than from simply averaging daily extent values. See the Sea Ice Index documentation for further information.
EDIT
Global sea ice tracking far below average
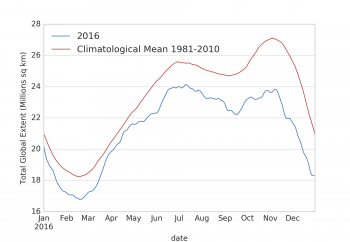
Figure 6a. This time series of daily global sea ice extent (Arctic plus Antarctic) shows global extent tracking below the 1981 to 2010 average. The X axis shows the month of the year, aligned with the first day of the month. Sea Ice Index data.
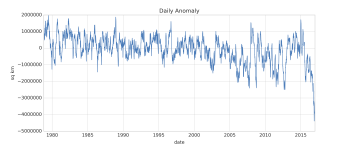
Figure 6b. This graph shows daily global sea ice difference from average, relative to the 1981 to 2010 reference period in square kilometers for the satellite record from 1979 through 2016
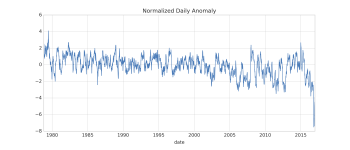
Figure 6c. This graph shows daily sea ice difference from average in units of the standard deviation (based on 1981-2010 variation from the average) for this period.
Global sea ice (Arctic plus Antarctic) continues to track at record low levels in the satellite record, but the deviation from average has moderated compared to what was observed in November. This reflects a December pattern of faster-than-average growth in the Arctic, and slightly slower-than average sea ice extent decline in the Southern Ocean. The gap between the 1981 to 2010 average and the 2016 combined ice extent for December now stands at about 3.0 million square kilometers (1.16 million square miles), down from a peak difference of just over 4 million square kilometers (1.50 million square miles) in mid-November. This globally combined low ice extent is a result of largely separate processes in the two hemispheres.
EDIT
http://nsidc.org/arcticseaicenews/