Another Climate Lie That Will Not Die - A Deliberately Mislabeled Ice Core Graph From 1997
A misleading graph purporting to show that past changes in Greenland’s temperatures dwarf modern climate change has been circling the internet since at least 2010. Based on an early Greenland ice core record produced back in 1997, versions of the graph have, variously, mislabeled the x-axis, excluded the modern observational temperature record and conflated a single location in Greenland with the whole world.
EDIT
The GISP2 ice core record was used in a number of papers in the late 1990s and 2000s that examined changes over the last ice age and the start of the current warm era — the Holocene — around 11,000 years ago. Around 2009, it caught the attention of Dr J Storrs Hall of the Foresight Institute, a technology-focused nonprofit group, who wrote a blog post suggesting that it disproved the idea that “human-emitted CO2 is the only thing that could account for the recent warming trend”.
That post was republished on a climate sceptic blog called Watts Up With That, which followed up with its own version of a GISP2 graph in late 2010 by Dr Don Easterbrook, an emeritus professor of geology at the Western Washington University. Easterbrook’s graph, shown below, was shared widely across the internet by climate sceptics and is still frequently seen — with many small variations — to this day in discussions on Twitter, blogs and news article comment threads.
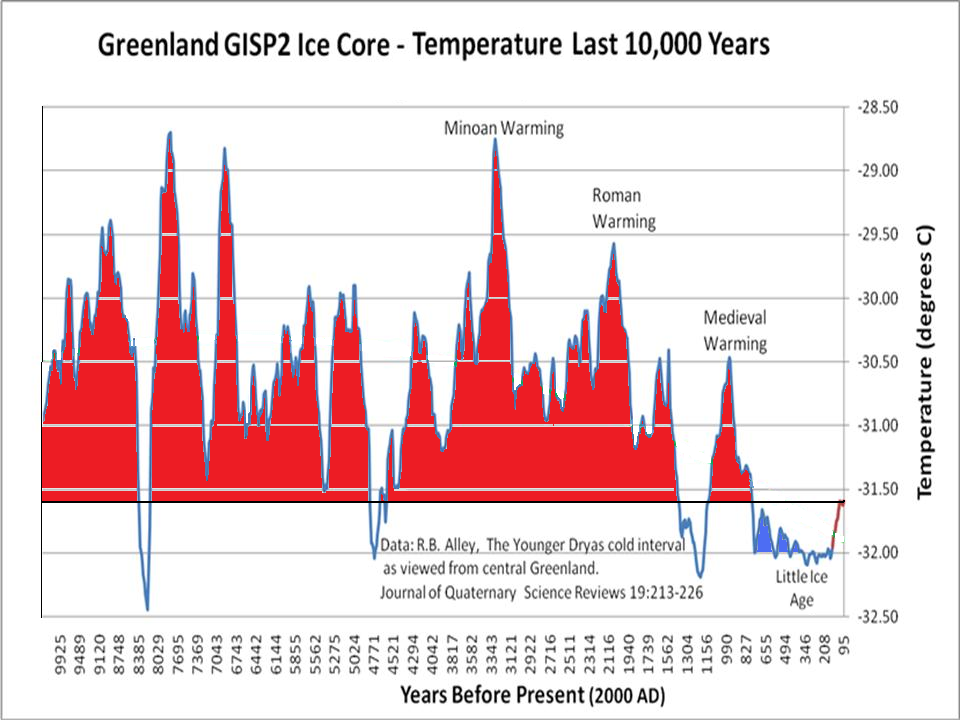
This graph is misleading for a number of reasons. First, the x-axis is mislabelled. In fact, it should say “Years before 1950”, rather than “Years before present (2000 AD)”. The GISP2 ice core only extends up to 1855 — 95 years before 1950. This means that none of the modern observational temperature period overlaps with the proxy reconstruction. (Easterbrook’s graph shows the uptick in the final 100 years or so of the record — shown in red — incorrectly indicating that it is the observational temperature period.)
The figure was also featured in another post on the same blog, which conflated Greenland with global temperatures. Any individual location will have significantly more variability than the globe as a whole. A single ice core is also subject to uncertainties around elevation changes and other perturbations to the ice core over time.
EDIT
https://www.desmogblog.com/2019/03/06/fact-check-greenland-ice-cores-proxy-past-present-climate-change
 = new reply since forum marked as read
