Environment & Energy
Related: About this forumNews Release: Tenth Edition of Data Book Reveals Trends in U.S. and Global Renewable Energy Growth
https://www.nrel.gov/news/press/2019/tenth-edition-of-data-book-reveals-trends-in-us-and-global-renewable-energy-growth.htmlLatest Release Includes Data for Electric Vehicles and Energy Storage for the First Time
March 11, 2019
U.S. renewable electricity grew to 19.7 percent of total installed capacity and 17.7 percent of total electricity generation in 2017, compared to 18.3 percent of total installed capacity and 15.6 percent of total electricity generation in 2016 according to the 2017 Renewable Energy Data Book (PDF), now in its 10th edition. Installed global renewable electricity capacity also continued to increase in 2017, representing 32.2 percent of total capacity worldwide.
Published annually by the U.S. Department of Energy’s (DOE’s) National Renewable Energy Laboratory (NREL) on behalf of DOE’s Office of Energy Efficiency and Renewable Energy, the Renewable Energy Data Book presents U.S. and global energy statistics compiled from numerous data sources and includes renewable electricity generation, renewable energy development, clean energy investments, and technology-specific data. Produced by NREL's Strategic Energy Analysis Center, the Data Book makes a wealth of renewable energy data accessible to a broad audience ranging from the interested public to the decision maker.
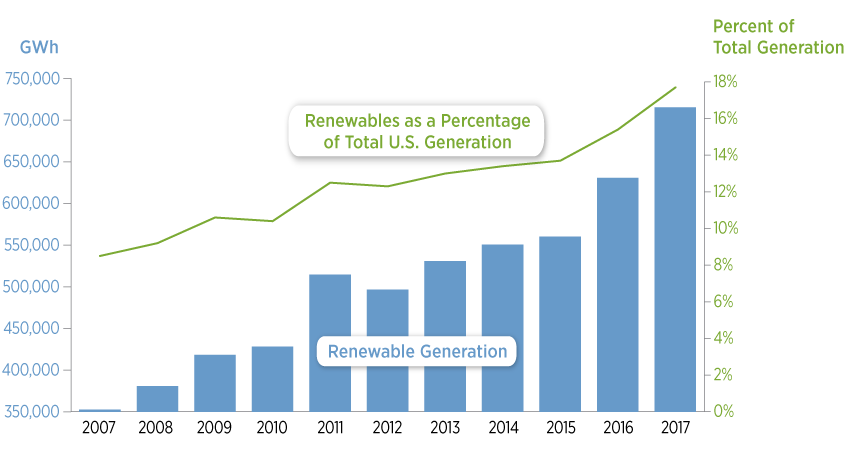
Graphic from the 2017 Renewable Energy Data Book highlights sustained growth in U.S. renewable electricity generation since 2007.
This year’s edition is the first to include data and trends for electric vehicles and energy storage technologies, in addition to data-centric charts for wind, solar, hydropower, and alternative fuels.
“Since the first Data Book release 10 years ago, we’ve seen U.S. renewable electricity generation grow from 8.5 percent of total generation in 2007 to 17.7 percent in 2017—more than doubling its share of the generation mix—with generation from solar and wind increasing by a factor of 10,” NREL Energy Analyst Sam Koebrich said. “This year, we expanded the Data Book to include information on emerging technologies including energy storage and electric vehicles, providing additional insights analysts, investors, and policymakers can use to assess U.S. and global renewable energy deployment and industry trends.”
Other key insights from the data include:
- In 2017, renewable electricity accounted for 60 percent of U.S. electricity capacity additions, compared to 67 percent in 2016.
- U.S. wind capacity increased by more than 8.3 percent (6.8 gigawatts) compared to 2016, accounting for more than 43 percent of renewable electricity capacity installed. Wind represented 7.5 percent of cumulative U.S. installed electrical capacity in 2017.
- U.S. solar electricity capacity increased by 26 percent (8.9 gigawatts) compared to 2016, accounting for more than 54 percent of newly installed renewable electricity capacity in 2017. Solar represented 3.7 percent of cumulative U.S. installed electrical capacity in 2017.
The Renewable Energy Data Book also includes state- and region-specific energy data and trends, along with statistics on clean energy investments and development worldwide.
NREL is the U.S. Department of Energy's primary national laboratory for renewable energy and energy efficiency research and development. NREL is operated for the Energy Department by The Alliance for Sustainable Energy, LLC.
 = new reply since forum marked as read
Highlight:
NoneDon't highlight anything
5 newestHighlight 5 most recent replies
= new reply since forum marked as read
Highlight:
NoneDon't highlight anything
5 newestHighlight 5 most recent replies

NNadir
(33,561 posts)...more "percent talk."
As long as this mathematically obscene Trumpian misrepresentation is allowed to stand, we have no hope of addressing climate change.
After 50 years of mindless cheering, and obscene fraudulent marketing, the so called "renewable" wind and solar industries don't produce 2% of the world's energy.
As reported in the most recent update of the World Energy Outlook published by the International Energy, solar, wind, tidal and geothermal and related wishful thinking do not, in "percent talk" produce 2% of the world's energy.
Maybe Trump doesn't know it; and maybe the general public engaged in screwing all future generations is willing to hear what it doesn't want to hear, but a BIG LIE, is still a lie.
I think I'll repeat this referenced report as often as I hear the same bullshit repeated by the so called "Renewable Energy" business, which is pretty much every damned day.
In this century, world energy demand grew by 164.83 exajoules to 584.95 exajoules.
In this century, world gas demand grew by 43.38 exajoules to 130.08 exajoules.
In this century, the use of petroleum grew by 32.03 exajoules to 185.68 exajoules.
In this century, the use of coal grew by 60.25 exajoules to 157.01 exajoules.
In this century, the solar, wind, geothermal, and tidal energy on which people so cheerfully have bet the entire planetary atmosphere, stealing the future from all future generations, grew by 8.12 exajoules to 10.63 exajoules.
10.63 exajoules is under 2% of the world energy demand.
2018 Edition of the World Energy Outlook Table 1.1 Page 38 (I have converted MTOE in the original table to the SI unit exajoules in this text.)
All the big deal marketing by the trivial so called "renewable energy" industry can avoid this truth:
Up-to-date weekly average CO2 at Mauna Loa:
Week beginning on March 3, 2019: 412.14 ppm
Weekly value from 1 year ago: 409.78 ppm
Weekly value from 10 years ago: 388.97 ppm
Last updated: March 12, 2019
https://www.esrl.noaa.gov/gmd/ccgg/trends/weekly.html
All the false innumerate bullshit marketing in the world will not reduce the rate of carbon dioxide concentration increases, over the last decade, of 2.3 ppm/year, the highest rate recorded since records have been kept, this while we "invested" trillion dollar sums in stuff that will be landfill in 20 years and that the infants of today will need to clean up, along with their planetary atmosphere.
So much for the "renewable data book."
progree
(10,920 posts)whereas the "Other renewables" in the IEA WEO does not include hydro and bioenergy
All of the numbers and graphs in the OP is about U.S. energy, with the exception of the one sentence
which I'll put aside for now. So just discussing the U.S. and focusing on the below:
The latter is electric energy, not capacity. Also, the 17.7% is 17.7% of total U.S. electric generation, *NOT* total U.S. energy use, which is 97.7 quadrillion BTUs / 37.2 quadrillion BTUs = 2.63 times larger (see below).
Referring to the Data Book, and to the 2017 numbers:
https://www.nrel.gov/docs/fy19osti/72170.pdf
In 2017:
Overall U.S. energy consumption: 97.7 quadrillion BTU in 2017
U.S. electric power sector energy consumption: 37.2 quadrillion Btu
U.S. renewable electricity grew to ... 17.7% of total electricity generation ... generating 715 terawatt-hours (TWh).
Now scrolling down to the second graph:
US energy consumption in 2017 is 97.7 quadrillion Btu where renewables is 11.3% of that:
Wind: 2.4%, Solar: 0.8%, Geothermal: 0.2%, Hydropower: 2.8%, and Biomass is 5.0%. Totaling 11.2% (within roundoff error of 11.3%)
So, according to the Data Book, U.S. Wind+Solar+Geothermal (roughly the equivalent of the IEA's "other renewables" ) is just 3.4% of total U.S. energy consumption (2.4% + 0.8% + 0.2% = 3.4%).
So that's not wildly inconsistent with those "other renewable" resources representing 1.82% of the world's energy consumption (IEA WEO Table 1.1 p. 38, 254/13972 = 1.82%). Given that developed countries have higher levels of electrification.
I haven't taken the time to look for the *world* energy production/consumption figures in the Data Book.
Nor have I taken the time to dig out the *U.S.* numbers in the IEA report.
I just wanted to take a moment to figure out why the U.S. renewable number in the Data Book seemed to be so wildly higher (in percentage talk
 ) than the IEA world renewable number in the IEA WEO report.
NNadir
(33,561 posts)That sort of focus of course, motivating Walmart Markeeter and Oil Sands Company "consultant," and, oh, um, "Renewable energy and Conservation Genius" Amory Lovins to announce back in 1976 that we'd all be living in suburban houses with solar heated "fused" salt tanks in our backyard by the year 2000.
"We're America! We're #1"...at something, hubris and self absorption maybe...
Lovins, like many others, was uninterested in considering whether Indians and Chinese, for just two examples, would agree to remain unimaginably impoverished while we all drove solar powered hydrogen hypercars.
I personally am holding my objections to biomass in abeyance, simply because it does seem - under very different circumstances - capable of participating in atmospheric carbon dioxide capture. Right now it's responsible for slightly less than half of the world's air pollution deaths, 7 million/year, but one can imagine it in oxyfuel situations being smokestack free.
It is also presently responsible for the death of a huge swath of the ecosystem of the Mississippi Delta via eutrophication and, um, the fact that Iowa plays a huge role in picking Presidents of the United States, but that might also be addressed.
And again, right now, biomass combustion kills people, but it could be cleaned up.
This said, even if used to capture carbon, all the agricultural cellulosic biomass, even divorced from food supplies, on the planet might only account for a few billion tons, even if gasified relatively locally, without drying and shipment.
We have a big problem on our hands, and we're still wasting time talking about whirlygigs and glass coated with toxic concoctions of exotic metals.
Air capture, even with biomass is an unbelievable engineering task, unbelievable. I'm just barely able to imagine it as technically feasible, just barely.
But then again, I shouldn't be all that negative. Tesla car! Elon Musk! Space X!
I feel better already. 412 ppm?!? Pfft. Child's play by the year 2100! I heard it over at 350.org. If that's wrong, if everything won't be fixed "by 2100," tough shit, I'll be dead and no one will be able to do a damned thing about it.
On the more serious side, I trust you're finding the World Energy Outlook a pleasant read...
progree
(10,920 posts)(which was essentially all U.S.) with the IEA WEO report.
And that in the U.S. the wind + solar + geothermal is a small percent of the total U.S. energy production / consumption (about 3.4%), not anything like 19.7% or 17.7% which is the impression one might get from a fast read of the OP.
Yes, you gave me some suggestions and I also came up with some "homework" for me to do. I'm just focused on my taxes because for the first time in 40+ years, I won't be using a tax preparer.
And the Minnesota legislature is discussing nuclear ... trying to get rid of the moratorium on new nukes. Or at least to credit the existing nukes (Prairie Island and Monticello, about 1500 MW combined total) as being carbon free for some renewable energy quota purpose.
You in turn, will be delighted to dig into the Fact Book ( https://www.nrel.gov/docs/fy19osti/72170.pdf ) and discover factoids, such as:
Meaning $3.3 trillion in a decade (if it stayed level), + inflation. ( "Clean" energy,
 )
)
NNadir
(33,561 posts)In the last ten years, the average rate of increase of carbon dioxide in the atmosphere has reached 2.3 ppm per year.
In the 20th century, it was 1.3 ppm/year.
These figures are based on the data available at the Mauna Loa Carbon Dioxide Observatory.
It's working great, just great, all that money thrown at so called "renewable energy."
Botany
(70,589 posts)N.t.