U.S. natural gas inventories end withdrawal season at lowest level since spring 2014
(Please note: Source: U.S. Energy Information Administration — Copyright concerns are nil.)
https://www.eia.gov/todayinenergy/detail.php?id=39152
April 19, 2019
U.S. natural gas inventories end withdrawal season at lowest level since spring 2014

Source: U.S. Energy Information Administration,
Weekly Natural Gas Storage Report,
Natural Gas Monthly
Working natural gas in storage in the Lower 48 states at the end of March totaled 1,137 billion cubic feet (Bcf) according to EIA’s
Weekly Natural Gas Storage Report. As of March 31, the usual end of the natural gas withdrawal season, working natural gas inventories were 30% lower than the previous five-year average for that time of year. This end-of-season level was the lowest since 2014, when working natural gas inventories at the end of March 2014 totaled 837 Bcf.
Working natural gas inventories
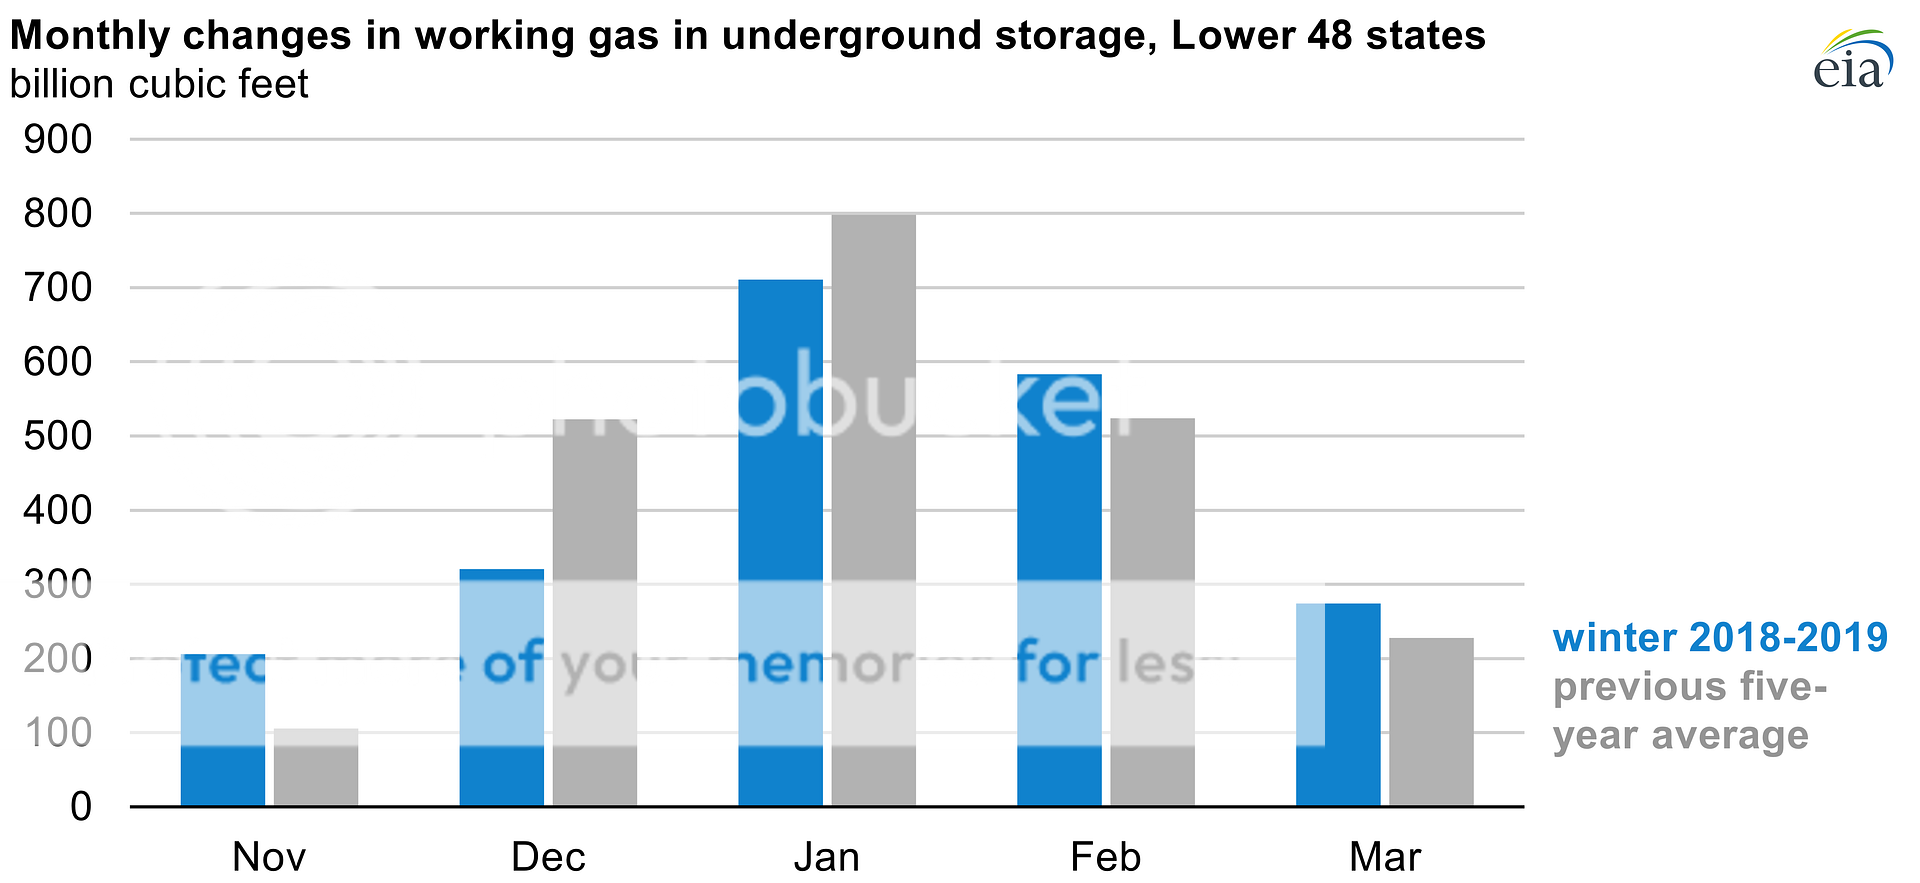
entered the winter heating season in November 2018 at 3,198 Bcf—the lowest level for that time of year in more than a decade—and declined during the winter at a rate consistent with historical trends.
In November 2018, relatively cold weather resulted in 206 Bcf of natural gas withdrawals, almost twice as much as a typical November. However, the pace of withdrawals slowed during December, with a monthly total of 320 Bcf compared with the five-year average of 523 Bcf. Net withdrawals in the remaining months of the 2018–2019 withdrawal season were within 20% of their typical values.
Source: U.S. Energy Information Administration,
Weekly Natural Gas Storage Report,
Natural Gas Monthly
EIA’s
Natural Gas Storage Dashboard provides visualizations of natural gas storage levels across the Lower 48 states as well as other factors that affect the amount of natural gas withdrawn from or injected into storage.
Principal contributor: Jose Villar