Environment & Energy
Related: About this forumFood and oil price correlation, 2000 to 2014
This graph is an update of the one I first published in 2010, showing the tight correlation between world oil and food prices. The correlation remains as obvious today as it was back then. As far as I know, my original graph was the first to demonstrate this relationship.
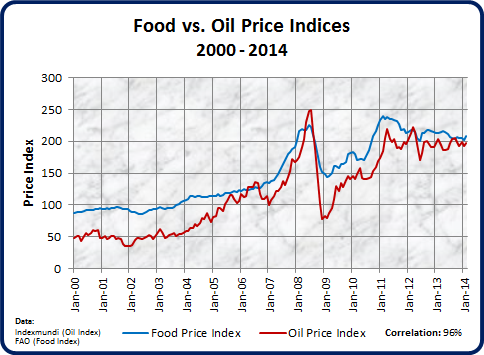
A paper published in 2011 showed that when the Food Price Index goes over 220 or so, the probability of widespread political unrest like the Arab Spring surges dramatically. Because of the tight linkage between food and oil prices, a rise in either price will therefore have the same effect. It seems to me that we are due for another round of linked oil and food price increases fairly soon.

 = new reply since forum marked as read
Highlight:
NoneDon't highlight anything
5 newestHighlight 5 most recent replies
= new reply since forum marked as read
Highlight:
NoneDon't highlight anything
5 newestHighlight 5 most recent replies

Warpy
(111,263 posts)especially out west. Drought out here is severe and a lot of farmers won't be planting, let alone harvesting. Cattle herds, especially, have been thinned out and beef prices have started to rise.
I just hope they get enough water down in Hatch for enough green chile to feed the state.
GliderGuider
(21,088 posts)Regional situations will of course be shaped by local factors. I expect that extreme weather events will exert progressively greater influences on world food supplies and prices as time goes on.
Warpy
(111,263 posts)and will compensate for low food production at home by buying products overseas. This will cause a global price jump.
Sometimes the regional does have a global effect, as long as the US is the region.
happyslug
(14,779 posts)This was the reason for the unrest in Tunisia, Egypt, the Persian Gulf States and even Saudi Arabia itself. All depend in the importation of grain to feed their people, and that mean US, Canadian, Australian, Argentina, Russian, Kazakhstan, Ukrainian, Indian or Brazilian Grain.
The old EU (excluding Poland) was a net foot exporter, but tended to import wheat and export other agricultural products. While a net exporter of Grain, the EU is not a huge exporter.
Mexico is a unique case. Pre-NAFTA, Mexico did not permit the importation of Corn, post-NAFTA, such importation was permitted and forced many a peasant farmer to go to the US to look for work, for he could no longer buy wanted he needed based on the corn in raised on his farm. When gasoline reached almost $4 a gallon and turning corn into fuel became the rage, the price of Corn rose and many a peasant farmer stayed home (Immigration stagnated in the years after 2008).
http://assuredlabor.com/2012/05/01/economic-growth-in-mexico-and-stagnation-in-us-causes-reversal-in-mexican-immigration-patterns/
http://www.abqjournal.com/346871/biz/mexican-economy-lures-emigrants-home.html
http://csis.org/files/publication/130711_Meacham_DiminishingMexImm_WEB.pdf
Total Grain Imports
Rank...Country........Quantity
Million Tons
1.........Japan.............24.0
2.........Mexico...........14.7
3.........Egypt.............14.2
4.........South Korea..12.9
5.........Saudi Arabia..12.6
6.........Iran................10.0
7.........Indonesia........9.3
8........Algeria.............8.2
9........China..............8.1
10......Morocco..........7.1
Four of the top ten importers of grain are middle eastern Countries (Five if you include Morocco).
Total Imports 295.8
As I said, above, Mexico is a special case, do to the increase in the price of Corn, rural peasants are returning to their farms and Mexican corn supplies should increase.
The United Kingdom, is roughly at the point where wheat imports and exports even out, this is typical of most western European nations:
http://www.farmersguardian.com/home/business/business-news/uk-could-become-net-exporter-of-wheat-again/60567.article
Remittance of earnings made in the US but sent to Mexico has dropped since 2007:
http://latimesblogs.latimes.com/world_now/2012/02/mexico-sees-remittances-rise-after-years-of-stagnation.html
Income of Mexican Immigrants declined since 1970:
http://www.ncbi.nlm.nih.gov/pmc/articles/PMC3744106/
While the average educational level of most Mexicans have gone up over the last 50 years, that is NOT true of immigrants into the US:
http://www.indigenousfarmworkers.org/education.shtml
Here are the 2012 net grain exporters:
Total Grain Exports
Rank Country Quantity
Million Tons
1......United States......49.0
2......Argentina............32.0
3......Australia..............21.9
4......Canada................21.9
5,,,,,,Ukraine................20.7
6......India...................17.5
7......Russia.................12.9
8......Brazil...................10.4
9......Kazakhstan...........7.2
10....European Union....7.0
The Ukraine exports more corn then Wheat, while Russia and Kazakhstan export more wheat then Corn.
http://www.usda.gov/oce/commodity/wasde/latest.pdf

LouisvilleDem
(303 posts)...somebody spotted the relationship between oil prices and food prices long before 2010.
GliderGuider
(21,088 posts)Many people intuited the relationship, but I could find no evidence that it had been demonstrated. If you have such evidence, I'd love to see it.
On edit - Here is my initial publication: Food Prices and Oil Prices
LouisvilleDem
(303 posts)Hanson, K., S. Robinson, and G. Schluter.
‘‘Sectoral Effects of a World Oil Price Shock: Economywide Linkages to the Agricultural Sector.’’
Journal of Agricultural and Resource Economics. 18,1(1993) 6–116.
Campiche, J., H. Bryant, J. Richardson, and J. Outlaw.
‘‘Examining the Evolving Correspondence between Petroleum Prices and Agricultural Commodity Prices.’’
Paper presented at the American Agricultural Economics Association Annual Meeting
Portland, OR, July 29–August 1, 2007.
GliderGuider
(21,088 posts)The 2008 crash and partial recovery is a feature that really stands out in the graphic presentation.
Unfortunately both the papers makes it sound like the issue is an American problem, and Campiche et al tie it directly to agriculturally-derived biofuels. Neither paper looks at global food prices, and neither would cause people (especially laymen) to see the direct correlation with global oil prices..
People have been playing with the correlation of food and oil prices in various ways for a while, but I'd never seen it laid out as clearly and accessibly as my graph does by anyone else - until after I'd published it.
Response to GliderGuider (Original post)
GliderGuider This message was self-deleted by its author.
Royk
(4 posts)What is the spearman's rank correlation coefficient of this graph?

rzemanfl
(29,563 posts)Thank you. Did you find it?
rzemanfl
(29,563 posts)gopiscrap
(23,761 posts)Thank you.
Royk
(4 posts)GliderGuider have you got the original data set of the Food vs. Oil Prices Indices graph? Regards.
GliderGuider
(21,088 posts)I just used web-available data for both. UN web site for food price index, and probable EIA data for oil prices. I futzed with the axes to make the correlation visible.
It's my impression that the correlation may have broken down since then due to the oil price weirdness, but I haven't re-done it recently.