Environment & Energy
Related: About this forumNSIDC ice melt for July almost exactly average
Average melt June 30 to July 31 is 2.698 million sq km. This year, 2.693 million sq km.
http://nsidc.org/arcticseaicenews/charctic-interactive-sea-ice-graph/
 = new reply since forum marked as read
Highlight:
NoneDon't highlight anything
5 newestHighlight 5 most recent replies
= new reply since forum marked as read
Highlight:
NoneDon't highlight anything
5 newestHighlight 5 most recent replies

intaglio
(8,170 posts)Your headline is deceptive and what might be expected from a climate change denier.
What period is your "average" taken. what kind of "average" is it, mean, mode or median?
In the graph to which you so helpfully link the black line is the 1981 - 2010 average (mean), the grey shaded area shows +/- 2 standard deviations from that mean, the dotted green line is the year of the record low extent in 2012. You might want to note that the 2014 figures are much closer to the record for 2012 than to the average.
You might also want to use the interactive feature to check something out and that is that the mean sea ice extent has been declining since 1979 with very short term hiccoughs and that 2007 seems to have marked a change to a far lower extent pattern.
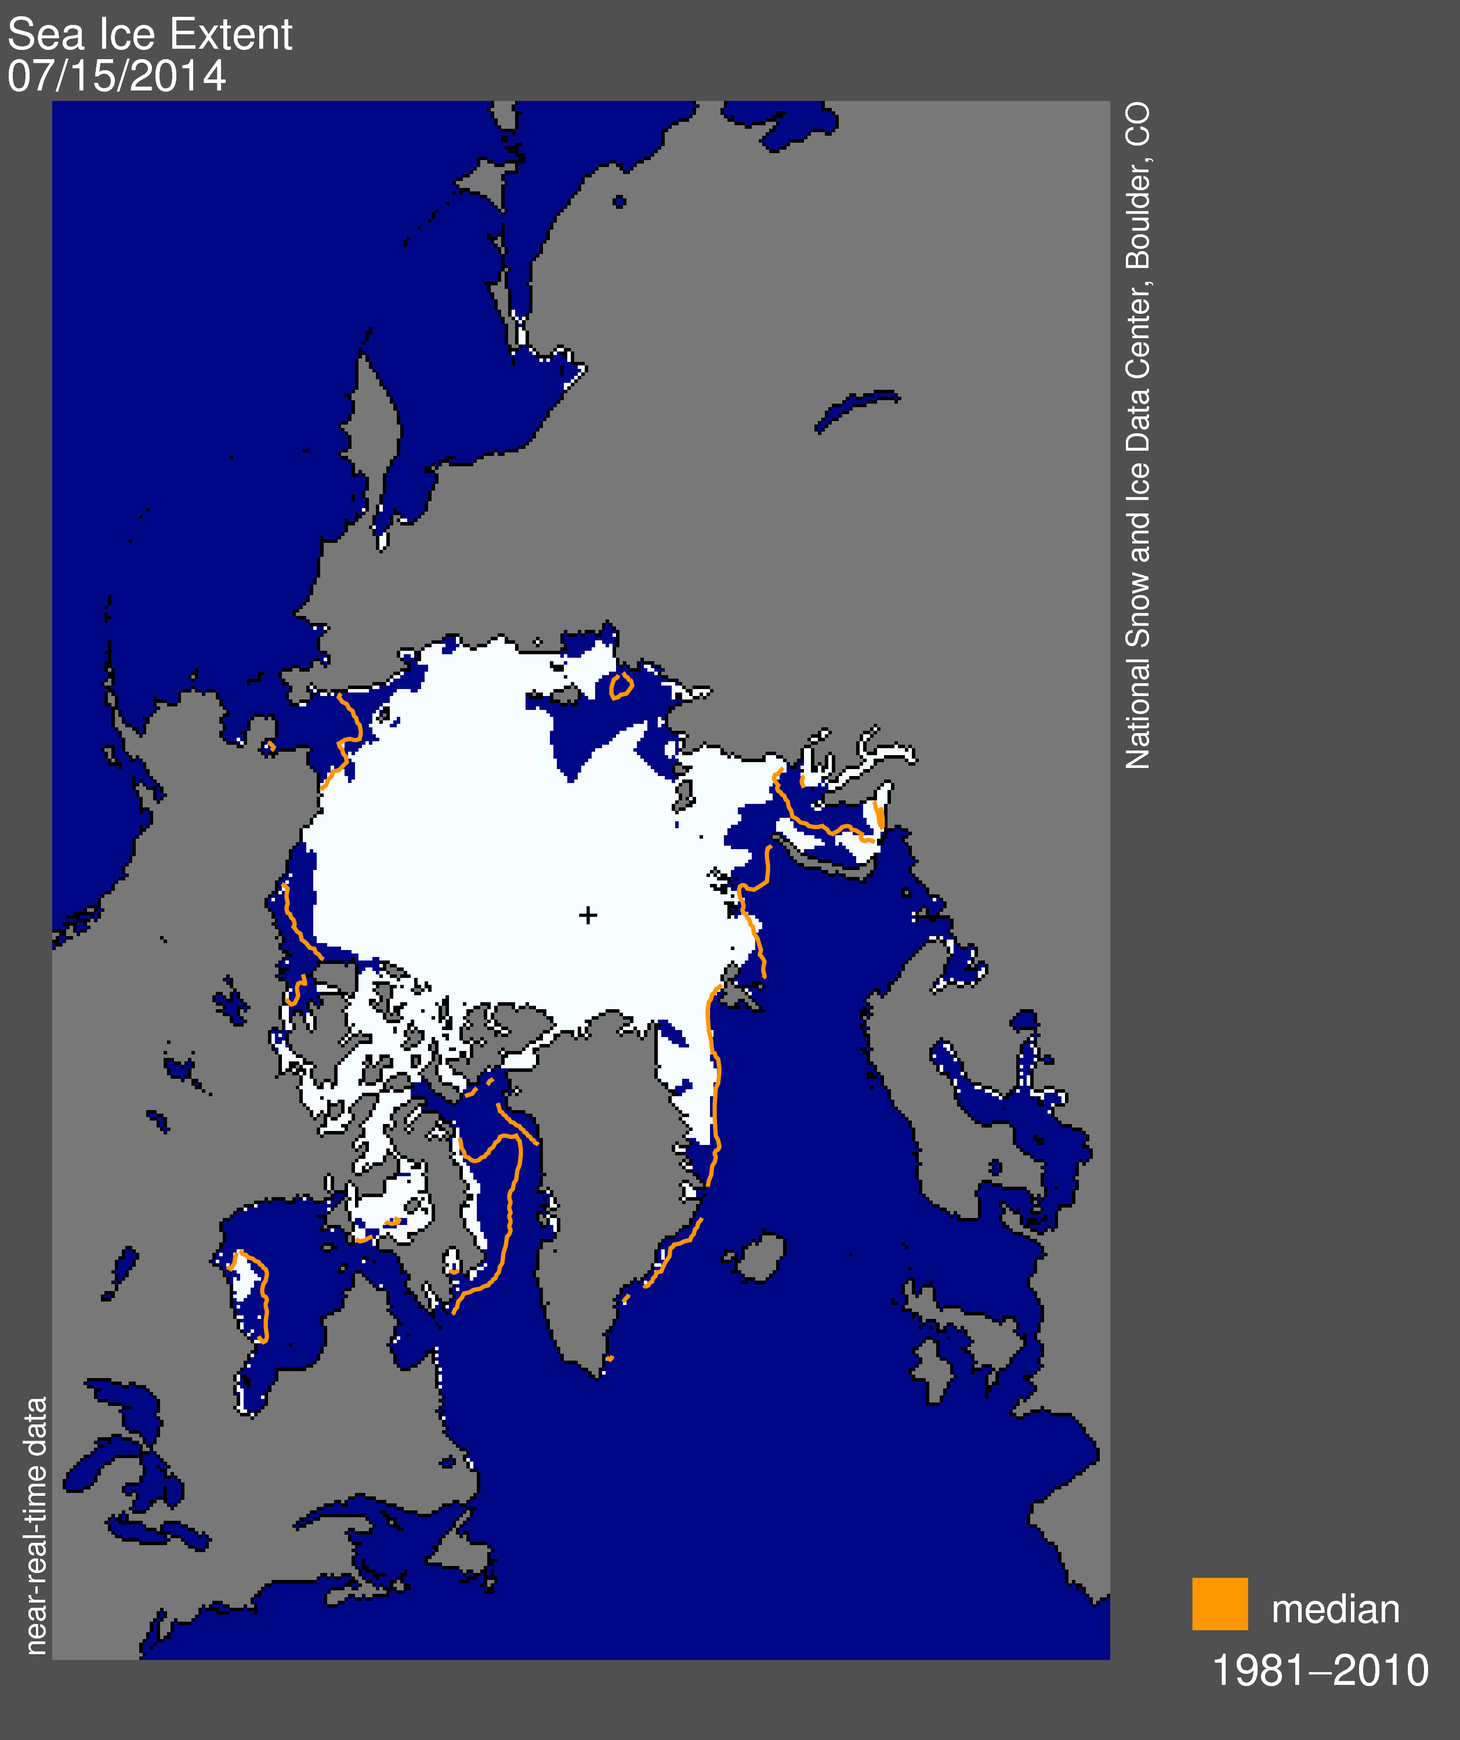
Another little problem with your deceptive headline is illustrated by the following graphic which demonstrates that sea ice extent (a different measure from area) is well below the average (median) sea ice extent for the 1980-2010 period.
OnlinePoker
(5,722 posts)Show a good news post about the ice and get labelled a climate change denier. In his post of 23 Jul, Hatrack posted the mid-July sitrep from NSIDC that showed sea melt for July was running 21% above average. I wanted to update how the full month finished, and I'm pretty sure when the month end report comes next week, it will say something similar.
http://www.democraticunderground.com/112772893
intaglio
(8,170 posts)Now you add the term "good news post;" how is it good news when the decline in sea ice coverage and extent is still tracking way below the multi-decade average.
OnlinePoker
(5,722 posts)PIOMAS is also showing ice thickness (as of the end of June - we'll have to wait for July) is better than any year since 2009. While still lower than average, to me these are signs of a moderate recovery in sea ice and should be seen as a positive development.
GliderGuider
(21,088 posts)More likely just a momentary ripple on an ebbing tide.
OnlinePoker
(5,722 posts)But with all the negative news we hear about the climate, I thought it would be good to see something positive (even if it does turn out to be temporary)
Response to OnlinePoker (Reply #4)
sue4e3 This message was self-deleted by its author.

sue4e3
(731 posts)Last edited Fri Aug 1, 2014, 04:57 PM - Edit history (1)
your supposed to stay in the proper spirit of doom.. since we're all going to die some day after all. Before any one gets all unhappy I'm just kidding. I have a morbid sense of humor and sometimes I just can't help my self.
intaglio
(8,170 posts)Within the margin of error of these measurements the figure for 31 July is precisely the same for 2009, 2010 and 2013. Another note is that on May 16 the record breaking year of 2012 was tracking above every year since 2001. I seem to recall WUWT hailing this as a sign that the Arctic ice was recovering
CRH
(1,553 posts)in relation to this years previous posts, ice extent for this July has not taken a dive that would indicate an exceptional year like 2007 or 2012. The situation is still near record lows, but as of now for 2014, at least for extent, the Arctic melt is near a break even pace. Ice volume is soon to report in this next week.
This report in relation to a week ago, is only an update. A lot can change in a hurry, but it is possible this year might be best measured by how the possible el nino might effect the length of the melt season, if at all.
Sea ice is complex, even the pro's don't hazard prediction.