[font face=Serif]December 9, 2014
[font size=5]Increased solar and wind electricity generation in California are changing net load shapes[/font]
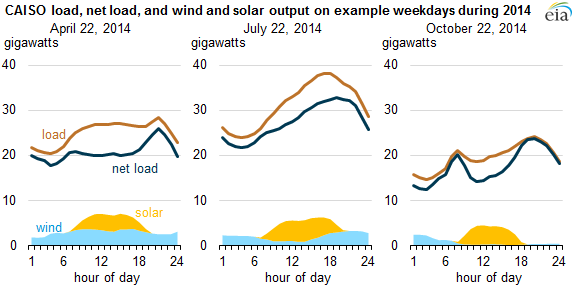
[font size=3]As more solar and wind electric generating capacity is added in California, the
California Independent System Operator (CAISO), the electric grid operator for most of the state, is facing an increasingly different net load shape. Net load—the total electric demand in the system minus wind and solar generation—represents the demand that CAISO must meet with other, dispatchable sources such as natural gas, hydropower, and imported electricity from outside the system.
Wind and solar plants do not incur any fuel costs to generate electricity, and, when available, they are
among the first resources that grid operators use. Utility-scale solar has exhibited
particularly significant growth in the past year, with hourly solar output reaching nearly 5 gigawatts (GW) by the end of September 2014. This amount represents more than 10% of the system's 2014 year-to-date hourly peak demand, and it is more than two-thirds higher than the peak hourly solar output level in 2013.
This capacity does not include smaller-scale (e.g., residential) distributed photovoltaic (PV) capacity that does not participate directly in CAISO's market. However, such behind-the-meter capacity impacts both the load and net load shape by reducing the overall system demand during periods when the sun is shining. The Solar Energy Industries Association estimated approximately 1.2 GWAC (1.4 GWDC) of residential capacity was installed in California through the second quarter of 2014, as well as a similar level of non-residential, non-utility installations—although CAISO data may partially account for the latter depending on individual interconnection arrangements.
Generation from solar units tends to coincide with electricity demand, producing electricity during daylight hours and achieving maximum output around midday. In the summer, when CAISO's load shape is driven by the demand for cooling, electricity demand tends to have a single peak in midafternoon. Solar output reduces the effective peak demand—and therefore reduces the generation needed from dispatchable units.
…[/font][/font]