Environment & Energy
Related: About this forumCatastrophic Sea Level Rise within Three Generations
Much more, along with pretty graphs and charts at the link.
 = new reply since forum marked as read
Highlight:
NoneDon't highlight anything
5 newestHighlight 5 most recent replies
= new reply since forum marked as read
Highlight:
NoneDon't highlight anything
5 newestHighlight 5 most recent replies

mackdaddy
(1,528 posts)The non linear seal level chart used in this article is showing 1 meter, about 3 feet of sea level rise in about 10 to 15 years. I saw an argument that this would flood out nearly every commercial ship container loading dock in the country and the world. This would be so disruptive to international trade activity that it could cause an economic depression.
Supposedly for each unit of rise, the ocean come in about 100 to 300 units horizontally inland. This would in just a decade or two take out nearly all beach front property, and low lying ocean towns. Examples would be what hurricane Sandy did to NYC and New Jersey, but on a regular basis. Miami Beach is currently spending hundreds of millions on seawalls and pumps as some of their streets are already being flooded on extra high tides called "King Tides". Just search King tides on youtube.
These sea level rise numbers are higher and faster than many current predictions, but every report I have read on the rate of loss of polar land ice says that the melt rates are much higher than predicted and the melt rate is accelerating.
A 3 foot increase would be bad, but if all the land ice melted the oceans would raise up to 240 feet which could still happen by the end of the next century.
This might be a very good time to sell your beach front property....

xrm67
(21 posts)“Bruuns Rule states that on average each 1cm of sea level rise results in about 1m of coastal recession. In other words, for each meter of sea level rise, the coastline is eroded, over time, by 100 meters. While this Rule has global application, coastal erosion in the Arctic is occurring at a much faster rate than predicted because of permafrost thawing and exposure of shorelines to wave action.”
http://www.skepticalscience.com/print.php?n=1051
mackdaddy
(1,528 posts)I have been doing a fair bit of reading on this, and it is hard to remember where I read some of this. It is better to have these links.
http://www.cmar.csiro.au/sealevel/sl_drives_short.html
yeoman6987
(14,449 posts)3 generations sounds a long time from now but it they said 50 years that might wake some up because it will affect immediate family members. I know that is selfish but if you look at climate change, selfish is the premium word of the day.

dixiegrrrrl
(60,010 posts)Could not agree more.
Creates a hell of a problem in economics, too.

muriel_volestrangler
(101,361 posts)The data the page seems to use to say it is exponential is the figures for ice volume loss in Greenland and Antarctica - which apparently doubled in Greenland in the last 5 years, and tripled in West Antarctica in that time. Those 2 points in time do not, however, give enough evidence on their own that the volume loss (and thus a contribution to sea level rise) is exponential. On the face of it, the processes driving the loss - more melting, less snow, or a combination - are not proportional to volume loss, so there's no reason to assume exponential growth without some more data points to actually show that in practice it is exponential.
Surface temperature rise has not been exponential, for example.
xrm67
(21 posts)Sea ice volume continues to decline rapidly, occurring at an exponential rate since 1979 according to the PIOMASS retrospective sea ice model corroborated by Naval Graduate School Regional Climate Models and CryoSat measurements. There is no reason to believe that land ice will behave any differently, especially with all the positive feedback loops at work. Time, as they say, will tell. Death by fire and flood.
muriel_volestrangler
(101,361 posts)It's clearly shown as linear in the graph with the value, and there's no mention of anything exponential at all on that page.
The NPS doesn't say anything about exponential either; but, given what has happened since that was published in 2013, it looks extremely unlikely their suggestion of an ice-free Arctic at its minimum by 2016 could happen now. PIOMAS shows March 2015 sea ice volume was about the same as March 2010, for instance.
The minimum volume was going down up until 2012; but it then increased in 2013, and again in 2014 (so the article written in early 2013 is very out-of-date). The long-term trend is down (-3200 km3/decade, according to PIOMAS), but there's a lot of yearly variation on top of it, which shows that taking just 2 rates and saying "it must be exponential" is invalid.
xrm67
(21 posts)Last edited Thu Apr 9, 2015, 11:17 AM - Edit history (1)
No, Arctic sea ice decline has been exponential. In addition, old ice has been replaced by much newer, thinner ice to the point that algae is now growing underneath the surface of the ice. Just this winter, a new record low was recorded.
Arctic temperature amplification from exponentially declining sea ice and spring snow cover are the strongest feedbacks in our climate system today. The average albedo (reflectivity) of the Arctic region has decreased from 52% to a present day value of 48% over 3 or 4 decades. The increased absorption of energy in the Arctic has increased the temperature at high latitudes at rates up to 6 to 8x the global average temperature change. The reduced temperature difference between the Arctic and equator has reduced the west to east speed of the jet streams causing them to slow and become wavier and more fractured, and directly causing a large change in the statistics of our global weather. - Link
More recently:
The Arctic sea ice is thinning at a steadier and faster rate than researchers previously thought, a new study based on combined observations finds...
...Critics have said that previous calculations of ice loss seemed too rapid, and questioned their value, the researchers said. But the new study shows the ice may be thinning at an even faster rate than the calculations showed, the researchers said.
“At least for the central Arctic basin, even our most drastic thinning estimate was slower than measured by these observations,” co-researcher Axel Schweiger, a polar scientist at the University of Washington Applied Physics Laboratory, said to to LiveScience. - Link
IPCC linear modeling had Arctic sea ice disappearing by the end of this century, but it's happening this decade. The IPCC is corrupted by corporate interests...
...An 'exponential decline' in sea ice - covered up by the IPCC
According to the WMO, Arctic sea-ice extent reached its annual minimum extent on 17 September 2014, at just a patch above 5 million sq.km - the sixth lowest on record, according to the National Snow and Ice Data Center.
"There is quite a lot of natural variation from year to year", he says. "But the downward trend is clear - an exponential decline. It is what you expect from positive feedback, and exponential decline is a better fit to the data than a linear decline."
And he insists that his conclusions are firmly founded on peer-reviewed science, specifically observations of sea ice thickness confirmed by Cryosat-2, together with satellite imagery. Worse, he alleges, the IPCC has tampered with the raw data in order to downplay the dangers the world faces... - Link
An exponential trend was confirmed a couple years ago...
PIOMAS data confirm exponential trend
muriel_volestrangler
(101,361 posts)If, for instance, the annual minimum last year was only the sixth lowest, there's no way you can call the decline 'exponential'. An exponential decline has to have a larger loss each year. PIOMAS figures may have looked like an exponential trend a couple of years ago, but since then we have had 2 years with substantially higher minima than previous years.
The point is that the OP is predicting the end of civilization (literally - it's titled 'Collapse of Industrial Civilization'), based on a claim that the rise in sea levels is mathematically exponential (not some hand-waving metaphor for 'fast'). A record small maximum does not mean 'exponential'. A linear trend would also give a record small maximum each year. And if you go to the NSIDC page that your link relies on for its figures, it says "the linear rate of decline for March extent is 2.6% per decade" (relative to the 1981 to 2010 average). They've drawn another graph, with a linear trend on it.
The loon who says the IPCC is tampering with data is a loon. We can hardly rely on someone like that to use 'exponential' accurately.
xrm67
(21 posts)Last edited Thu Apr 9, 2015, 04:29 PM - Edit history (2)
Increases in Arctic sea ice are, as I said, new ice formed by freshwater that has melted off inland glaciers. As glaciers melt, they pour cold freshwater into the ocean. This freshwater is less dense and easier to freeze than salty seawater. If this is accounted for, then your "higher minima" of sea ice goes out the window and an exponential trend is clear. You can still have upward fluctuations on a downward trend. That is the same thing that has happened in the Antarctic which climate change deniers cling to as proof that everything is OK. You can sit there and call people loons all day long while the polar caps melt away, but you're not changing the reality on the ground.
Expanding Antarctic Sea Ice is Flooding ‘Warning Bell’
"The stunning outward spread of ice floes atop the seas surrounding the South Pole has been caused by cold freshwater flowing out of melting Antarctic glaciers."
http://www.climatecentral.org/news/antarctica-ice-melt-sea-level-18155
--------------
Arctic melt leading to weakest Gulf Stream in a 1,000 years
The currents are probably affected by changes in ocean density as fresh water melts from Arctic ice sheets, scientists led by the Potsdam Institute for Climate Impact Research said in a study Monday in the journal Nature Climate Change.
http://www.smh.com.au/environment/climate-change/arctic-melt-leading-to-weakest-gulf-stream-in-a-1000-years-20150323-1m6102.html
muriel_volestrangler
(101,361 posts)having a link to new ice. Maybe you're having a conversation on another board that's confusing you?*
" If this is accounted for, then your "higher minima" of sea ice goes out the window and an exponential trend is clear. "
No, that doesn't follow at all. Your earlier claim was that (Arctic) sea ice was decreasing at an exponential rate, but I showed the figures show that's not true - PIOMAS shows it as linear. Now you're claiming (without any evidence) that there are different classes of sea ice in the Arctic, and that this somehow makes a difference to your earlier claim.
The paper about the Gulf Stream is about liquid water in the North Atlantic, not ice.
I think I need to reiterate: I am quoting the science on this, which is saying there's downward trend in sea ice, which looks linear. This is nothing to do with denying climate change. There are indications that ice loss on land, which is what matters for sea level rise, could be speeding up. But the claim of a 7m rise in 55 years that the OP link makes is not supported - we do not have enough data yer to know if there's a regular trend, whether linear, exponential, or what.
*ah, now I get it - you're the author of the post linked to in the OP - 'xrm' = 'xraymike'.
xrm67
(21 posts)No, I'm having a conversation with someone who did not bother to read all the links in the article. It clearly states in the article:
"Upwelling of warm ocean waters are melting both polar regions from the bottom up, and the resulting large freshwater pulses are already slowing down ocean currents."
And there are links in the article explaining this which you did not bother to read before spouting your nonsense. If you can't understand the difference between old sea ice and newly formed sea ice from glacial melt, then there is no point in your argument.
From NOAA:
Very little old sea ice remains in the Arctic (updated through 2014 melt season)
All seven of the smallest September (summer minimum) ice extents in the satellite record have occurred in the last seven years, part of the evidence of the decades-long trend in Arctic warming. But surface area isn’t the only quality of the ice that is changing. Wind and ocean circulation patterns are conspiring with a warmer climate to reduce the amount of year-round (multi-year) ice, transforming the remaining ice into a younger, thinner version of its old self.
Do you know what old sea ice is or, for that matter, any type of sea ice? I'll help you to understand:
Classification based on age
Another classification used by scientists to describe sea ice is based on age, that is, on its development stages. These stages are: new ice, nilas, young ice, first-year and old.[4][5][6]
New ice, nilas and young ice
New ice is a general term used for recently frozen sea water that does not yet make up solid ice. It may consist of frazil ice (plates or spicules of ice suspended in water), slush (water saturated snow), or shuga (spongy white ice lumps a few centimeters across). Other terms, such as grease ice and pancake ice, are used for ice crystal accumulations under the action of wind and waves.
Nilas designates a sea ice crust up to 10 centimetres (3.9 in) in thickness. It bends without breaking around waves and swells. Nilas can be further subdivided into dark nilas – up to 5 centimetres (2.0 in) in thickness and very dark, and light nilas – over 5 centimetres (2.0 in) in thickness and lighter in color.
Young ice is a transition stage between nilas and first-year ice, and ranges in thickness from 10 centimetres (3.9 in) to 30 centimetres (12 in), Young ice can be further subdivided into grey ice – 10 centimetres (3.9 in) to 15 centimetres (5.9 in) in thickness, and grey-white ice – 15 centimetres (5.9 in) to 30 centimetres (12 in) in thickness. Young ice is not as flexible as nilas, but tends to break under wave action. In a compression regime, it will either raft (at the grey ice stage) or ridge (at the grey-white ice stage).
First-year sea ice
Distinction between 1st year sea ice (FY), 2nd year (SY), multiyear (MY) and old ice.
First-year sea ice is ice that is thicker than young ice but has no more than one year growth. In other words, it is ice that grows in the fall and winter (after it has gone through the new ice — nilas — young ice stages and grows further) but does not survive the spring and summer months (it melts away). The thickness of this ice typically ranges from 0.3 metres (0.98 ft) to 2 metres (6.6 ft).[4][5][6] First-year ice may be further divided into thin (30 centimetres (0.98 ft) to 70 centimetres (2.3 ft)), medium (70 centimetres (2.3 ft) to 120 centimetres (3.9 ft)) and thick (>120 centimetres (3.9 ft)).[5][6]
Old sea ice
Old sea ice is sea ice that has survived at least one melting season (i.e. one summer). For this reason, this ice is generally thicker than first-year sea ice. Old ice is commonly divided into two types: second-year ice, which has survived one melting season, and multiyear ice, which has survived more than one. (In some sources,[4] old ice is more than 2-years old.) Multi-year ice is much more common in the Arctic than it is in the Antarctic.[4][7] The reason for this is that sea ice in the south drifts into warmer waters where it melts. In the Arctic, much of the sea ice is land-locked.
http://en.wikipedia.org/wiki/Sea_ice
muriel_volestrangler
(101,361 posts)measurement, let alone any argument that there is exponential change in either. This is your basic problem - you assert that change is exponential from just 2 values, and then try to extrapolate that. It's a bit rich for you to accuse me of not knowing a little science, when I'm the one who has had to correct you on what 'exponential' means. No, your 'article' (blog post) has no links about freshwater pulses. You just mention it.
You're wrong that sea ice is decreasing exponentially; you have not got anything like enough evidence to show that land ice is decreasing exponentially, let alone to have any idea of the doubling rate. You're trying to distract from your failure with a red herring about different types of sea ice. That wasn't your argument, until I showed your claims about exponential decline were wrong.
If you want to look at the thickness of ice, it's worth seeing what has happened recently:
...
The Polar Science Center thickness graph basically shows the same thing, with average thickness higher than any other year since 2007:
http://neven1.typepad.com/blog/2015/04/piomas-april-2015.html
Things are far more complicated than "it's all going wrong, and exponentially", and the attempted extrapolation of 7m of sea level rise in 55 years is just invalid.
xrm67
(21 posts)A freshwater pulse is simply another term for meltwater pulse and yes it is talked about in my links:
Dr. James Hansen has argued all along that 5 meters of sea level rise by the end of the century is possible, saying:
“…IPCC treats sea level change basically as a linear process. It is more realistic, I believe, that ice sheet disintegration will be non-linear, which is typical of a system that can collapse.”
You say:
...you have not got anything like enough evidence to show that land ice is decreasing exponentially, let alone to have any idea of the doubling rate.
I'll state the evidence again since it is not getting through to you and I doubt it ever will:
Monthly changes in the total mass (in Gigatonnes) of the Greenland ice sheet estimated from GRACE satellite measurements between March 2002 - July 2013. The blue and orange asterisks denote April and July values, respectively. Note that the decline in ice mass lost from Greenland is not a straight line--it is exponential, meaning that in general, more ice loss is lost each year than in the previous year. - Link
An initial doubling time has been established. Now we must see if it holds up, slows down or speeds up:
The planet’s two largest ice sheets – in Greenland and Antarctica – are now being depleted at an astonishing rate of 120 cubic miles each year. That is the discovery made by scientists using data from CryoSat-2, the European probe that has been measuring the thickness of Earth’s ice sheets and glaciers since it was launched by the European Space Agency in 2010.
Even more alarming, the rate of loss of ice from the two regions has more than doubled since 2009, revealing the dramatic impact that climate change is beginning to have on our world. - Link
Now getting back to the sea ice, you say:
"You're wrong that sea ice is decreasing exponentially..."
Arctic sea ice decline has been documented to be exponential. As I explained earlier, you have to differentiate between old ice and new weaker ice. The devil is in the details:
According to the scientists, the Arctic Ocean has experienced exponential loss of thick, multi-year sea ice in the past 12 years, and the amount was less than half the average of 1979-2000 last September. - Link
How else can I explain this to you before it sinks in?
GliderGuider
(21,088 posts)
muriel_volestrangler
(101,361 posts)Yes, Hansen argues for non-linearity - but he doesn't put it forward as a prediction of 7m in 55 years, but, possibly, 5m in 85 years. And he thinks negative feedbacks kick in once you get to one metre rises. Haranguing people about exponential change when your primary source is saying it won't be exponential once the rise gets to a notable size is ridiculous.
That's the first time you've linked to climatecrocks, or talked about GRACE satellite measurements, so it's pointless claiming you're stating it again. It's possible that is roughly exponential, though it was remarkably linear up to 2010, before an acceleration - but last year, the decline stopped:

http://www.arctic.noaa.gov/reportcard/greenland_ice_sheet.html
"An initial doubling time has been established. "
No, it hasn't. There is not enough data for that. Some people are guessing it could be exponential, and are then guessing a doubling period.
"Arctic sea ice decline has been documented to be exponential."
No; the documentation says 'linear'. I've given the linear figure.
"As I explained earlier, you have to differentiate between old ice and new weaker ice."
You have given no reason why the PIOMAS volume measurement, which is given as a linear decline by PIOMAS, should need differentiation between old ice and 'new weaker ice' ('weaker'? That's the first time you've talked about weaker ice. We've been talking about thickness, but the PIOMAS volume measurement already depends on thickness as well as area). And we've seen that average thickness is back up to the 2007 level.
xrm67
(21 posts)I can go all day long referencing the same facts from different sources and you can continuously deny it all day long. Climatecrocks links to peer-reviewed research just as I have done with similar articles.
This is obviously too much for you to wrap your mind around. The bottom line is that a doubling time has been established and now we have the privilege of seeing how exactly it all plays out. We have already locked in roughly 70 feet of SLR no matter what we do because it is irreversible. Are you going to argue with me about the definition of "irreversible"?
I will write a blog post about this and hopefully answer your questions once and for all when I get more time next week.
Oh, and the meltwater pulse is talked about in that quoted link from my article. You just didn't read it.
muriel_volestrangler
(101,361 posts)It has not been established that it's exponential. Hansen suggested it might be, a couple of years ago, but didn't know if it's 5 or 10 years, and said it wouldn't last as exponential. There is evidence the glacier melting is speeding up. There's not enough data to show it's exponential - we see that in 2014 the Greenland mass balance was steady. We're trying to work off just a few years' observation. Extrapolating that as exponential over 55 years is unreasonable.
"We have already locked in roughly 70 meters of SLR"? Where have you pulled that from? That's a bit more than the complete melting of all of Greenland and all of Antarctica would produce (6m + 60m). On your blog you talk about Jason Box's reference to 69 feet of sea level rise for the CO2 level in the atmosphere we now have - are you confusing feet and metres? 'Irreversible' does need to be considered, though - in the talk Box gave, he points out that part of the problem with Greenland is that if a certain amount of the ice on it slumps to lower altitudes, then the change does mean only a new cold period could stop all the melting to that equilibrium level; but if we did lower the CO2 before then, we might avoid getting to the historic equilibrium point (which is where the 69 feet figure comes from). And he says people really don't know how fast sea level rise might happen; he suggests up to 6 feet by 2100, which, again, is a lot different from 7 metres in 55 years.
Looking through the several links in your post, all I can find is a mention of the historical meltwater pulse 1A of 14,000 years ago in this one: http://earlywarn.blogspot.co.uk/2012/01/hansen-still-argues-5m-21st-c-sea-level.html . That's not talking about a meltwater pulse like one we've had recently that caused a disruption of ocean currents; it's saying the pulse was the melting of glaciers, far more rapidly than what we're seeing now. It's saying melting can be non-linear, not that it's the same situation we have now (after all, that was exiting a glacial period). And how does that blog post end?
This is what I've been saying, all through this thread: we don't have enough data to make any decent prediction about an exponential sea level rise.
xrm67
(21 posts)Last edited Thu Apr 9, 2015, 10:58 PM - Edit history (2)
What don't you get about this? Can you read the sentence in bold which was published in every news media outlet?
'Incredible' rate of polar ice loss alarms scientists
The planet’s two largest ice sheets – in Greenland and Antarctica – are now being depleted at an astonishing rate of 120 cubic miles each year. That is the discovery made by scientists using data from CryoSat-2, the European probe that has been measuring the thickness of Earth’s ice sheets and glaciers since it was launched by the European Space Agency in 2010.
Even more alarming, the rate of loss of ice from the two regions has more than doubled since 2009, revealing the dramatic impact that climate change is beginning to have on our world.
The researchers, based at Germany’s Alfred Wegener Institute Helmholtz Centre for Polar and Marine Research – used 200m data points across Antarctica and 14.3m across Greenland, all collected by CryoSat, to study how the ice sheets there had changed over the past three years. The satellite carries a high-precision altimeter, which sends out short radar pulses that bounce off the ice surface and then back to the satellite. By measuring the time this takes, the height of the ice beneath the spacecraft can be calculated.
It was found from the average drops in elevation that were detected by CryoSat that Greenland alone is losing about 90 cubic miles a year, while in Antarctica the annual volume loss is about 30 cubic miles. These rates of loss – described as “incredible” by one researcher – are the highest observed since altimetry satellite records began about 20 years ago, and they mean that the ice sheets’ annual contribution to sea-level rise has doubled since 2009, say the researchers whose work was published in the journal Cryosphere last week.
The Hansen article I inked to and which you are quoting from is more than 2 years old and was before the recent discoveries mentioned above. The polar ice caps are melting more than twice as fast as what Hansen and others had predicted. What don't you get about that?
And about the 70 feet of SLR already locked in, that was in my article as well which you evidently have trouble comprehending:
Melting polar and glacial ice and thermally expanding ocean water have accelerated SLR to the highest rate in at least 6000 years, and an estimated 69 feet SLR has already been set into motion.
Edit: In my last comment I did say 70 meters and actually meant feet. 69 feet = 21 meters, still beyond catastrophic.
muriel_volestrangler
(101,361 posts)It means that ice loss increased. You cannot validly extrapolate from those 2 points to a 55 year exponential sea level rise.
As far as the 69 feet rise goes, it was pulled from a graph by Richard Alley. Here's a talk, in which he does talk about that (about a minute in):
It's a good talk; he's one if the experts in this area. He does not 'non-linear' means 'exponential'. He explains ice loss can depend largely on the disappearance of ice shelves, which happens in fits and starts. Once an ice shelf goes, there is faster flow from the glaciers behind it - but they don't continue speeding up exponentially.
xrm67
(21 posts)Last edited Fri Apr 10, 2015, 10:58 AM - Edit history (1)
You are typical of a climate change denier who will completely sidestep evidence placed right in front of their face. I gave you the link to the 69 foot SLR already already locked in and you go and pick some other video from someone else. Here is the link describing why we are locked into nearly 70 feet of SLR, as argued by Jason Box:
http://www.motherjones.com/environment/2013/01/climate-desk-greenland-and-69-feet-sea-level-rise
Concerning the exponential growth in SLR that we may very well be in the beginning stages of:
The rate of change in SLR per year has been 1 to 1.4mm since 1900, but jumped to 3.2mm since 1990. That is a 100% to 200% increase for the last couple decades.
http://www.climatecentral.org/news/sea-level-rise-accelerating-18543
Now in the last five years, ice mass loss from the two largest ice sheets on the planet, Greenland ice sheet and West Antarctic Ice Sheet (WAIS), have more than doubled.
http://theenergycollective.com/josephromm/471941/greenland-and-west-antarctic-ice-sheet-loss-more-doubled-last-five-years
And the the stability of East Antarctica is being undermined in the same way:
http://www.washingtonpost.com/news/energy-environment/wp/2015/03/16/the-melting-of-antarctica-was-already-really-bad-it-just-got-worse/?postshare=8171426579871259
Summary:
SLR has increased by 100-200% in the last two decades compared to the rate of change from the beginning of the twentieth century and there has been a more than doubling in the amount of ice mass loss in the planets two largest ice sheets with East Antarctica showing signs of doing the same thing.
So any rational person can now see than an exponential doubling period has been established and we will be watching to see if it holds up over time.
muriel_volestrangler
(101,361 posts)and says that it may not be inevitable, depending on whether global temperatures can be decreased before the ice sheets lose altitude.
" we will be watching to see if it holds up over time" - that's the point. Exponential growth happens because the size of a value directly affects the future growth of the value (eg a population, or compound interest). Without a definite mechanism established for the direct relationship, all you know is that the rate is growing. You don't know it's exponential. Alley gives the reasons why they expect it to grow unevenly.
It's your assumption of 'exponential' that is incorrect.
xrm67
(21 posts)We already have several data points showing exponential growth as I just showed you. Duhh. And yes, we don't have a time machine to see exactly how it will play out. I suspect it will progress in fits and starts, but if someone were to graph it over the next century, the trend would indeed be exponential.

Systematic Chaos
(8,601 posts)
muriel_volestrangler
(101,361 posts)GliderGuider
(21,088 posts)Over a few years it could look like fits and starts. over a century an exponential trend could easily become visible, revealing those fits and starts to be just noise in the data.
This isn't rocket science.
muriel_volestrangler
(101,361 posts)would be truly bizarre. You get exponential growth when the rate of change is proportional to the value. If the rate of change can slow down a lot, it indicates there are factors involved that are not proportional to the value. And why would the rate of change then increase again?
The word 'exponential' gets misused a lot. Usually, people just mean 'accelerating'.
xrm67
(21 posts)Here is the real condition of Arctic sea ice and it's not good:
At Start of 2015 Melt Season, Arctic Sea Ice is in a Terrible State
...In the extent measure we find that for the past month running we have been at or near new record lows. Over recent days, consistent with the strong surge of polar heat amplification, extent values have again plummeted past previous record low values. Dropping by more than 50,000 square kilometers for each day in the April 6-8 timeframe, the melt rate is exceedingly steep for this time of year. With April 8 achieving a new record low extent of 14,073,000 square kilometers — 95,000 square kilometers below the previous record low of 14,168,000 set in 2006...
National Snow and ICe Data Center: A Double Dip
...Arctic sea ice extent for March 2015 averaged 14.39 million square kilometers (5.56 million square miles). This is the lowest March ice extent in the satellite record. It is 1.13 million square kilometers (436,000 square miles) below the 1981 to 2010 long-term average of 15.52 million square kilometers (6.00 million square miles). It is also 60,000 square kilometers (23,000 square miles) below the previous record low for the month observed in 2006...
xrm67
(21 posts)By the way, the 1972 Limits to Growth study was never proven wrong, but was recently validated. In other words, we are on track for the collapse on industrial civilization.
Limits to Growth was right. New research shows we're nearing collapse
The 1972 book Limits to Growth, which predicted our civilisation would probably collapse some time this century, has been criticised as doomsday fantasy since it was published. Back in 2002, self-styled environmental expert Bjorn Lomborg consigned it to the “dustbin of history”.
It doesn’t belong there. Research from the University of Melbourne has found the book’s forecasts are accurate, 40 years on. If we continue to track in line with the book’s scenario, expect the early stages of global collapse to start appearing soon...

LouisvilleDem
(303 posts)I think you and the researcher who says the forecasts have been accurate didn't read the entire book. Limits to Growth got resource consumption wrong, GDP per capita wrong, and pollution levels wrong. Sure, if you cherry pick predictions you can make it look like it got things right, but only if you ignore all the things it got very, very wrong.
xrm67
(21 posts)I suppose these researchers are wrong as well with their 26 charts of planetary overshoot by human activity:
“It is difficult to overestimate the scale and speed of change. In a single lifetime humanity has become a planetary-scale geological force,” says lead author Professor Will Steffen, who led the joint project between the International Geosphere-Biosphere Programme (IGBP) and the Stockholm Resilience Centre.
And these guys with their charts of planetary boundaries transgressed by human activity must also be wrong when they say crazy stuff like this:
Earth is halfway to being inhospitable to life, scientist says
Rockstrom’s planetary boundary theory was first conceived in 2007. His new paper reveals that because of climate stability, which began when the Ice Age ended 11,000 years ago, a planetary calm helped our ancestors to cultivate wheat, domesticate animals, and launch industrial and communications revolutions. But those advances have strained the stability of the planet, and Rockstrom says we have broken four boundaries: too much nitrogen has been added to ecosystems, too many forests have been cut down, the climate is changing too quickly and species are going extinct at too great a rate...
And this can't be true, can it?
The Last Time Oceans Got This Acidic This Fast, 96% of Marine Life Went Extinct
...In 2013, marine scientists released a "State of the Oceans" report that found that the rate of current acidification was “unprecedented.” They noted that the seas were acidifying faster than any point in the last 300 million years. That study didn’t take into account the new data, of course, but that’s the timeline we’re dealing with: The last time the oceans were so acidic was in the midst of the greatest extinction in the history of the world.
Yes, I'm sure they're all wrong. Where's my TV remote? Pass me the buttered popcorn.
LouisvilleDem
(303 posts)Nothing in your post contradicts the fact that Limits to Growth got a great many things horribly wrong. For example, it predicted that we would run out of natural gas in 1990 and oil in 1992. Today oil reserves are higher than they were when the report was published. You can post new predicts of doom all you want, but the bottom line is that in science, when observations do not match what your theory predicted, your theory is wrong. Period.
xrm67
(21 posts)"The United States is the new Saudi Arabia and on its way to energy independence" ----is this the fairy tale you are subscribing to these days?
Do you understand the difference between conventional and unconventional oil?
Do you know what diminishing EROEI is?
Do you understand anything about financial bubbles in the energy sector?
No, It's obvious you don't and I'm not going to waste my day explaining to you how the world works. You are on your own.
LouisvilleDem says:"You can post new predicts of doom all you want, but the bottom line is that in science, when observations do not match what your theory predicted, your theory is wrong. Period."
I suggest you do a little more research rather than quoting climate change deniers like Judith Curry and the latest propaganda from the fossil fuel industry.
LouisvilleDem
(303 posts)I made a specific claim:
Today oil reserves are higher than they were when the report was published.
Now this claim is either true or it is false. If it is false, please provide a link to a source for your claim.
Here is mine:
 ?00cfb7
LouisvilleDem
(303 posts)...without the exponentially increasing energy required to melt it?
It all comes down to the earth's energy balance. The amount of energy coming in from the sun is constant, despite what deniers say about sunspot cycles etc. Yes, more heat is getting trapped in the atmosphere due to increasing levels of CO2, but that effect is not increasing exponentially and never will. The idea that you can have exponentially declining sea ice without a cooresponding increase in the amount of energy coming into the system defies the laws of physics.
xrm67
(21 posts)Last edited Fri Apr 10, 2015, 01:37 AM - Edit history (1)
The Earth's climate turned out to be much more sensitive to human forcings than most could imagine:
“It’s Worse Than We Thought” — New Study Finds That Earth is Warming Far Faster Than Expected
Earlier this week, a new study emerged showing that the world was indeed warming far faster than expected. The study, which aimed sensors at the top 700 meters of the World Ocean, found that waters had warmed to a far greater extent than our limited models, satellites, and sensors had captured. In particular, the Southern Ocean showed much greater warming than was previously anticipated.
Winds and a very active downwelling, likely driven by a combined freshening of water near Antarctica and an increased salinity due to warming near the equator, drove an extraordinary volume of heat into these waters. An extra heat in the oceans that was 24 to 58 percent higher than previous estimates. An extraordinary rate of uptake earlier measures had missed...
...This observation led New Scientist to make the following rather blunt statement:
"It’s worse than we thought. Scientists may have hugely underestimated the extent of global warming because temperature readings from southern hemisphere seas were inaccurate."
The implications of finding this extra heat are rather significant. For one, it upends current Equilibrium Climate Science. Gavin Schimdt — Chief NASA GISS scientist — over at RealClimate, noted that the study’s findings would increase ECS ranges from 1.1 to 4.1 C to 1.1 to 4.7 C (a 15% percent increase by Gavin’s calculation). This increase shows that the Earth System may well be both far more sensitive to current human heat forcing and may well be likely to warm far faster this century than scientists had previously hoped. For broader context, it’s worth noting that the scientific community generally considers ECS to be in the range of 1.5 to 4.5 C (3 C average). And any analysis of the new findings is likely to push sensitivity to the higher range of these scales.
Dr Wenju Cai from CSIRO in Australia added by noting that the results mean the world is warming far faster than we thought:
“The implication is that the energy imbalance – the net heating of the earth – would have to be bigger,” he says.
Higher rates of Earth Systems responses to human heat forcing this century and a larger net energy imbalance in the global system together spell very bad news. What this means is that there is both more heat forcing now than we at first expected and that that heat forcing is likely to bring about more extreme climate consequences far sooner than we had initially hoped.
These findings are new and will take some time to ring through the scientific community.
And as I have said repeatedly, this is borne out by the recent discovery of a doubling time of less than five years in Greenland and Antarctic ice melt:
Greenland And West Antarctic Ice Sheet Loss More Than Doubled In Last Five Years
GliderGuider
(21,088 posts)of 7.8C per doubling?
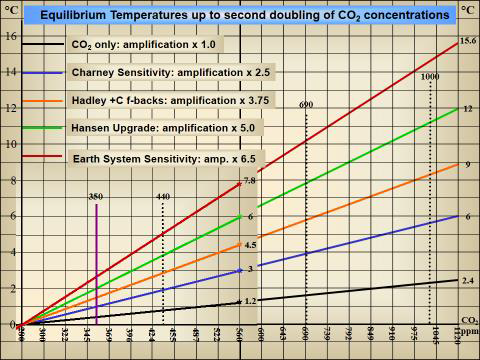
From: Sensitivity, Non-Linearity & Self-Amplification in the Global Climate System
LouisvilleDem
(303 posts)At some point in time you have to explain why your predicted temperature rises are not matching observations. That's why almost all of the recent peer reviewed articles--which Wasdell's presentation is not--are revising their estimates of ECS downward, not upward.
http://link.springer.com/article/10.1007%2Fs00382-014-2342-y#page-1
xrm67
(21 posts)LouisvilleDem
(303 posts)Her position on global warming places her well within the 97% of scientists that believe in global warming. What she is not, is a believer in catastrophic global warming, which is just as an anti-science a position as denial.
xrm67
(21 posts)And Nicholas Lewis is no better:
https://denierlist.wordpress.com/2012/12/19/nic-lewis/
LouisvilleDem
(303 posts)How do you get exponentially declining sea ice without the exponentially increasing energy required to melt it? Nothing in your post or any of the links you provided in it suggest exponentially increasing energy.
xrm67
(21 posts)You'll have to explain why the Keeling curve is continuously hitting new highs.
LouisvilleDem
(303 posts)Besides, CO2 isn't doesn't increase exponentially. If it did, we would quickly run out of fossil fuels.
GliderGuider
(21,088 posts)Can you?
CO2 IS increasing exponentially - both in emissions and concentration.
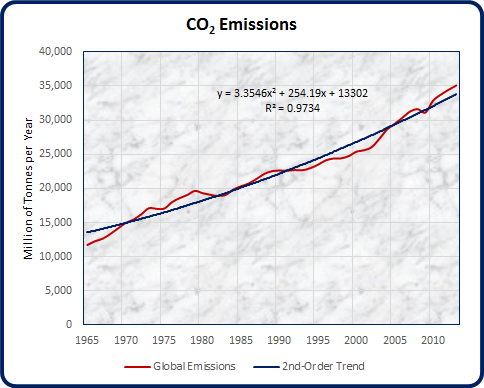
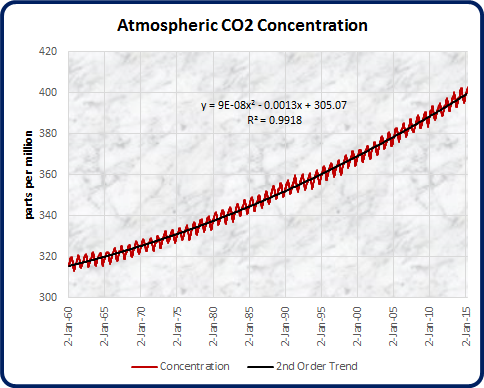
LouisvilleDem
(303 posts)You could fit a straight line to both of those graphs just as easily. It is far too early to say whether or not those curves will turn out to be exponential or not. More importantly, as I said earlier, if you actually did have exponential CO2 emission increases you would quickly run out of fossil fuels.
xrm67
(21 posts)The clueless says: "Nothing in your post or any of the links you provided in it suggest exponentially increasing energy."
LouisvilleDem
(303 posts)Are you saying that the ice will be melted not by energy coming from the increased greenhouse effect, but by the energy being generated by humans?
mackdaddy
(1,528 posts)On the way down in the bus
One expert says we are falling at an exponential rate because of gravity!
Tho other expert says but you are not looking at terminal Velocity!
And a voice in the back of the bus says:
"I think this argument will end before it is finished".
xrm67
(21 posts)As the world continues to experience higher temperatures leading to greater thermal expansion and ice melt, future sea level predictions are troubling. In 2007, the IPCC estimated sea levels will rise between seven and twenty-three inches this century, creating “worsen[ed] coastal flooding and erosion during storm surges.” This prediction is likely inaccurate, however, considering sea levels rose at a rate sixty-percent faster than the IPCC’s projected rate for 1993 to 2011. Environmentalists look at this excessively low past prediction and infer “that IPCC sea-level projections for the future may also be biased low.” Although many environmentalists stress this IPCC projection is low, some courts and agencies remain unwilling to recognize the excessive dangers of any sea level rise higher than the IPCC’s projection. In Ballona Wetlands Land Trust v. City of Los Angeles, Ballona Wetlands Land Trust (Trust) challenged a revised environmental impact report for a proposed coastal project. The Trust cautioned against taking on projects in coastal areas, citing a paper by the California Climate Change Center that noted the risks of such projects to inhabitants of coastal areas. Entitled “The Impacts of Sea-Level Rise on the California Coast,” the paper warned developers of the risks of “a significant sea level rise . .. as a result of global climate change.” In response, the City of Los Angeles stated that the paper’s sea level projection “represented an extreme worst case scenario, relied on a faulty methodology, and overstated the flood risk.” Providing a report from an engineer rather than an environmentalist, the city claimed that the IPCC’s significantly lower projection provided a “more reliable estimate of sea level rise,” than the Trust’s projection. Finding for the city, the court concluded that the IPCC projections provided an adequate estimate of sea level rise for the environmental impact report and subsequently permitted the coastal development. Other courts faced with the issue of rising sea levels should recognize, contrary to the result in Ballona, that the IPCC’s prediction for the coming century may be excessively low because it does not factor in a possible ice melt acceleration. The general opinion of environmentalists is that sea level rise over the next century is going to be far worse than indicated by the IPCC’s projections. The IPCC’s excessively conservative projections pose serious implications for coastal areas around the United States where water levels are increasing at rates higher than the global average. Without accurately estimating the actual figures for potential sea level increases, these areas will be unprepared for the imminent danger that lies ahead…
…Although the government is aware of the threats of rising sea levels, including the potential destruction of cities such as New York City, New Orleans, and Miami, it is doing little to respond to these risks. Instead of working to minimize coastal cities’ exposure to rising sea levels, “government policies are encouraging development in the areas most vulnerable to sea-level rise.” In Miami, Florida’s government is “racing to subsidize new developments along the coast, through state-run insurance and funding for coastal protection,” while nationwide, the federal government is “encouraging construction on coastal property that’s most at risk from sea-level rise.” As illustrated by Chief Justice Roberts’ dissent in Massachusetts, some government officials are still unwilling to acknowledge that sea level rise causes particularly significant and concerning coastland loss. Although Congress recognizes the need to prepare for sea level rise, it provides little guidance on how this should be done. By not fully combating the effects of rising sea levels, the government is creating problems for itself both in the way of regulatory takings claims, and ultimately, the destruction of valuable coastal communities… – Excerpts from a paper written for Villanova University School of Law
Why quote IPCC AR4 when AR5 has been out for over a year?
xrm67
(21 posts)Last edited Fri Apr 17, 2015, 03:04 PM - Edit history (1)
The article was written last year before AR5 came out and nothing has changed for the better. So what is your point?