Environment & Energy
Related: About this forumGrowth (rate) in world solar and wind power is declining.
Last edited Fri Jun 19, 2015, 12:14 PM - Edit history (1)
From a first look at the BP Statistical Review 2015 data.
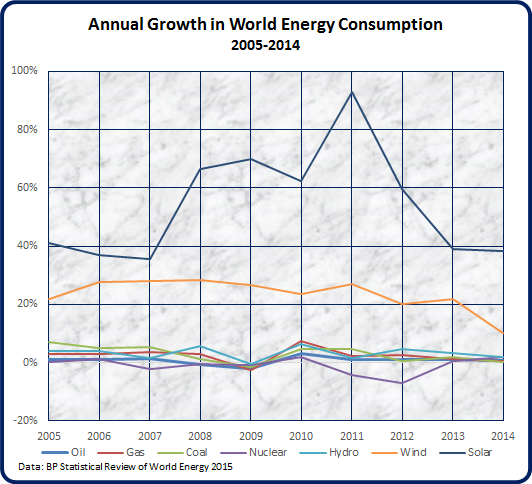
Over the last three years (2012-2014) growth in the world's consumption of solar and wind electricity consumption has declined markedly compared to the four years before 2012.
Nuclear power consumption has stabilized since its post-Fukushima drop. Hydro consumption has grown an average of 3.4% pa over the last three years, while fossil fuel consumption has averaged 1.1% pa growth over the same period.
 = new reply since forum marked as read
Highlight:
NoneDon't highlight anything
5 newestHighlight 5 most recent replies
= new reply since forum marked as read
Highlight:
NoneDon't highlight anything
5 newestHighlight 5 most recent replies

OKIsItJustMe
(19,938 posts)[font size=4]Solar power shows up at scale[/font]
[font size=3]New installations totaling 40.2 GW in 2014 took global solar power generating capacity to 180 GW by year-end, a 28.7% increase versus the end of 2013. Capacity has more than quadrupled in the past four years

The largest increments in 2014 were recorded in the Asia Pacific region; China added 10.6 GW, just ahead of Japan with 9.7 GW, together accounting for more than half of the growth in global solar capacity. The US provided the third largest addition (6.2 GW). Germany remains the world leader for cumulative installed capacity (38.2 GW), but China (28.2 GW) and Japan (23.3 GW) have both overtaken Italy to take second and third place.
Solar power generation enjoyed another year of very rapid growth in 2014, with a 38% increase. Its overall share of global power generation remains low (0.8%), but that share has doubled in just two years. Solar is starting to have a noticeable impact in terms of sources of power generation growth, contributing nearly 15% of the growth of global power in 2014.
…[/font][/font]
http://www.bp.com/en/global/corporate/about-bp/energy-economics/statistical-review-of-world-energy/review-by-energy-type/renewable-energy/wind-energy.html
[font size=4]Maintaining rapid growth, wind power generating capacity grew by 16.2% in 2014, with capacity increasing by 52GW to reach 373GW by the end of 2014[/font]
[font size=3]Wind power now generates 706TWh of electricity, 3% of total world electricity generation. That is almost equivalent to the total power generation of Germany and the Netherlands combined.
China leads the world in terms of installed wind capacity (115GW), and in 2014 China recorded the largest addition of new wind capacity (23GW), followed by Germany (6GW) and the US (5GW).

In 2014 Asia Pacific overtook Europe & Eurasia to become the largest regional market in terms of total installed wind power capacity, with 147GW (39% of the world total) versus Europe’s 135GW.
Wind has become an important contributor to European electricity generation. In Denmark wind power provided 41.4% of power generation in 2014. Wind power now provides 15% or more of power generated in Spain, Portugal, Ireland, in Lithuania. Germany, which overtook Spain as the largest wind power producer in Europe in 2014, obtained 9.1% of its power from wind last year. Wind has a much smaller share in the US,the largest wind power producer in the world, where it contributes 4.3% of power generation.
…[/font][/font]
http://www.bp.com/en/global/corporate/about-bp/energy-economics/statistical-review-of-world-energy/review-by-energy-type/primary-energy.html
[font size=4]World primary energy consumption grew by 0.9% in 2014. This was the slowest growth rate since 1998 other than the decline in the aftermath of the financial crisis[/font]
[font size=3]Growth was below average in all regions except North America and Africa. All fuels except nuclear energy grew at below-average rates. Oil remains the world’s dominant fuel, Hydroelectric and other renewables in power generation both reached record shares of global primary energy consumption (6.8% and 2.4% respectively).

…[/font][/font]
I know, I know, you’re looking at the slope of the growth curve, not the curve itself, but exponential growth curves will all falter eventually…
http://www.bp.com/en/global/corporate/press/bp-magazine/conversations/six-remarkable-energy-facts-from-2014.html
…
[font size=4]6. Two sides to every story: how renewables fared[/font]
[font size=3]“I’d describe the renewables story as one that can be viewed as ‘half-full’ or ‘half-empty’. On one side, there’s the fact that the growth in renewables (including biofuels) accounted for almost a third of the total increase in primary energy in 2014, and provided more than 40% of the increase in power generation. These are big numbers.
On the other side of the coin – a more ‘half-empty’ story – is that renewables energy growth in 2014 remained robust at 12%, but that’s below the 10-year average of 15.4%. This slowdown was driven by wind which grew at less than half of its ten-year rate, reflecting both less public policy support (in EU and US) and low wind speeds (in China). Overall, renewables only provided 3% of primary energy.
So, how to explain this growth at the same time as a seemingly static state for renewables? Essentially, overall growth rate of energy demand slowed, but the renewables sector continued its ‘normal’ growth as it’s not sensitive to the demand side. But, because the overall growth in energy demand slowed so sharply, renewables accounted for a larger share of a smaller pie.”
 [/font][/font]
GliderGuider
(21,088 posts)
OKIsItJustMe
(19,938 posts)Exponential growth cannot be expected to continue indefinitely.
Arithmetically, the increases are still dramatic.
GliderGuider
(21,088 posts)It's not actually all that pessimistic, because 40% yoy growth last year for solar is still a moon-rocket trajectory. Wind is sitting at about 10% yoy growth, which is still respectable - 5x that of hydro and nuclear, and 14x the growth rate of fossil fuels.
It's evidence of what alc said below - that early growth rates by definition can't stay at 30% to 50% yoy for long.
It just surprised me that solar seems to be coming off the off the super-exponential part of its growth curve this soon. It has a long way to go, and I expected to see it stay above 50% yoy for a few years more.
Wind declining from a growth rate of 30% to 10% over 6 years is not as big a surprise because of planning, siting and logistics issues.
OKIsItJustMe
(19,938 posts)Growth is still going strong.
GliderGuider
(21,088 posts)I changed the headline, just for you.

alc
(1,151 posts)Say you add 100 THINGS per year for 4 years. Growth over the years is
1st to 2nd year: 100% (100 to 200)
2nd to 3rd year: 50% (200 to 300)
3rd to 4th year: 33% (300 to 400)
To have positive growth every year you'd need to add 100 the first year, then 101, then 202, then 404. After not too many years (about 20) you'll need to add 1 million/year to grow.
From this chart you can't even tell if capacity is growing or slowing. It's "world consumption" and a few Chinese non-solar/wind energy plants could dominate consumption growth even if solar/wind capacity grew.
The other issue with wind and solar is finding locations that make sense. The more you build the harder it is to find the next place to build.

Bill USA
(6,436 posts).. in a finite system.
.... the amount of resources required to maintain the same proportional growth increases to the point you find you don't have enough resources to keep up the same proportionate growth.
GliderGuider
(21,088 posts)As I said above, what surprised me was that solar has apparently stepped off the super-exponential portion of the curve so soon.

NNadir
(33,533 posts)Despite the fact that humanity squandered $1.8 trillion on these material wasting environmentally destructive scams, they are both trivial forms of energy.