Gun Control & RKBA
Related: About this forumFrom the other Group: Speaking of twisting statistics!
The original thread is here:
http://www.democraticunderground.com/12628274
Naturally, it contains all the usual framing from that side... facts and statistics, when they do not conform, become "facts" and "statistics". Suicides by firearm and homicides by firearm are mingled, as if it doesn't matter in a discussion of violent crime! And of course, rights become "rights".
Spoiler alert: it ends with "Guns and current lax gun legislation is a menace to our society, and to our democratic form of government." But, of course, they don't want to take away anybody's guns, they just wish really really hard that gun owners will voluntarily choose melt their guns down.
Some key points need refutation, so let's get started! Whee!
[div class=excerpt style=background:#AFEEEE]
National rates of gun homicide and other violent gun crimes are strikingly lower now than during their peak in the mid-1990s, paralleling a general decline in violent crime, according to a Pew Research Center analysis of government data. Beneath the long-term trend, though, are big differences by decade: Violence plunged through the 1990s, but has declined less dramatically since 2000.
This statistic is offered by the right-wing gun lobby as proof that gun violence is down to almost nothing, concealed carry deters crime, and no further gun control measures are necessary. In fact, they use this "rapidly reducing gun crime" statistic as an argument for further relaxing of gun laws and wider approval of open/concealed carry "rights."
The real reason the crime rate plunged is because of progressive social policy, not progressive or conservative gun policy. Crime rates began to plunge in about 1988 and settled in about 2003. This drop started a generation after the widespread use of birth control to women (the pill, the IUD), nationwide abortion rights (Roe v. Wade), and the removal of lead from our gasoline, and thus our air and water. Airborne lead was, of course, more concentrated in crowded urban areas, so removing this lead had the most dramatic effect in our cities.
Since most violent crime is committed by people (usually males) between the ages of 15 and 15, this meant that the kids born after, say 1973 were a) far less poisoned by brain-damaging lead, and b) less likely to be born in social circumstances conducive to a life of violent crime. So, in 1988 the "freshman" class of likely violent criminals was a lot smaller than the "graduation" class, and this trend continued until the early 2000's. At that point, the "freshman class" and the "graduation" class became about equal.
We could be cutting the crime rate a lot more with other liberal policies, except that the pro-control's obsession with outlawing protruding pistol grips pushes many people into the Republican camp.
[div class=excerpt style=background:#AFEEEE]
Researchers continue to debate the key factors behind changing crime rates, which is part of a larger discussion about the predictors of crime. There is consensus that demographics played some role: The outsized post-World War II baby boom, which produced a large number of people in the high-crime ages of 15 to 20 in the 1960s and 1970s, helped drive crime up in those years.
There is substantial variation within and across regions and localities in a number of other realms, which complicates any attempt to find a single cause for national trends. Among the variations of interest to researchers are policing techniques, punishment policies, culture, economics and residential segregation.
Other factors contributing the reduced gun homicide rate are believed to be increased and improved ER response time and expertise, and vastly improved emergency room facilities and treatment.
Other reasons for the decline include:
...for all the attention given to America’s culture of guns, ownership of firearms is at or near all-time lows. Since 1973, the GSS has been asking Americans whether they keep a gun in their home. In the 1970s, about half of the nation said yes; today only about one-third do. Driving the decline: a dramatic drop in ownership of pistols and shotguns, the very weapons most likely to be used in violent crimes.
Gun violence dropped dramatically nationwide over the past two decades, but nearly three-quarters of all homicides are still committed with a firearm, the Justice Department said in a report released Tuesday.
"Other factors contributing the reduced gun homicide rate are believed to be increased and improved ER response time and expertise, and vastly improved emergency room facilities and treatment."
Really?

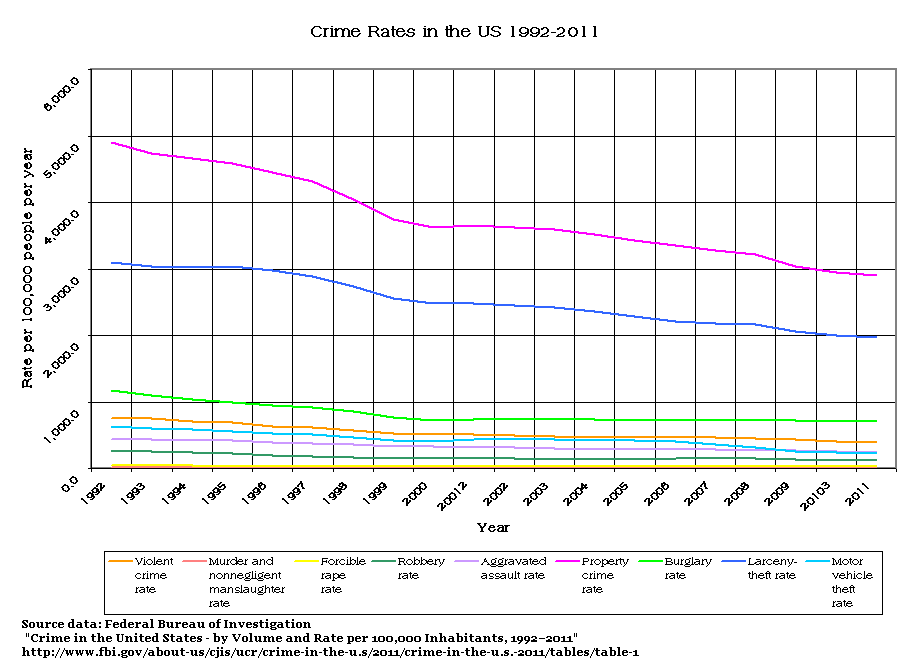
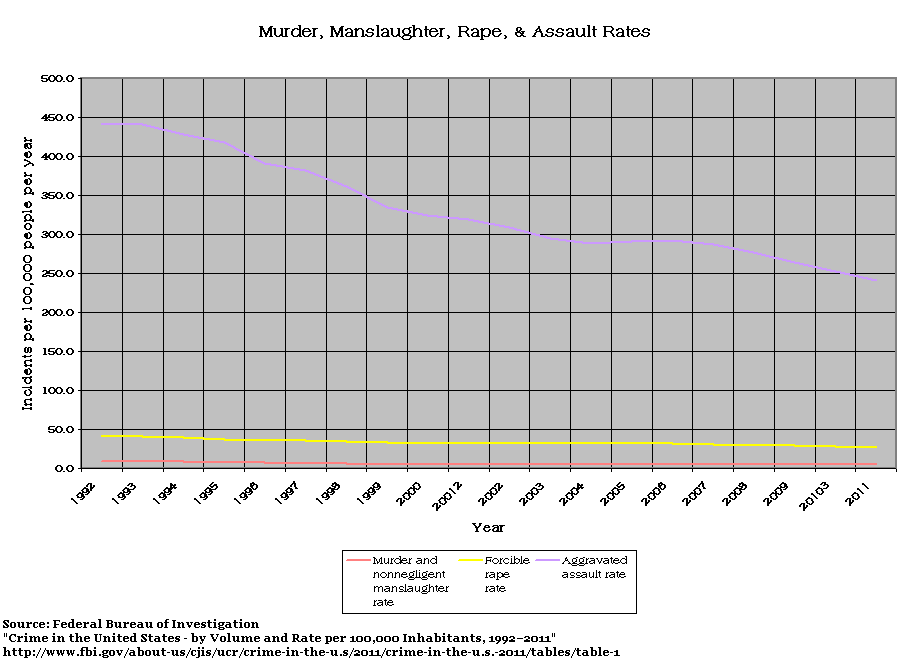
Look at the "aggravated assault" lines, please. Now, correct me if I'm wrong, but if increased medical expertise and reduced 911 response times were a major factor in the reduction of murder, then wouldn't there be a corresponding increase in assault? After all, a failed murder attempt becomes an assault, yes?
But we don't see that. The murder rate drops about 40%, as do assaults, rapes, and robbery. Non-violent crimes drop about the same.
The reason is the same one I gave above: the pool of people (males age 15-25) that are most likely to commit crime, particularly violent and street crime, is much smaller than due to liberal social policies.
[div class=excerpt style=background:#AFEEEE]
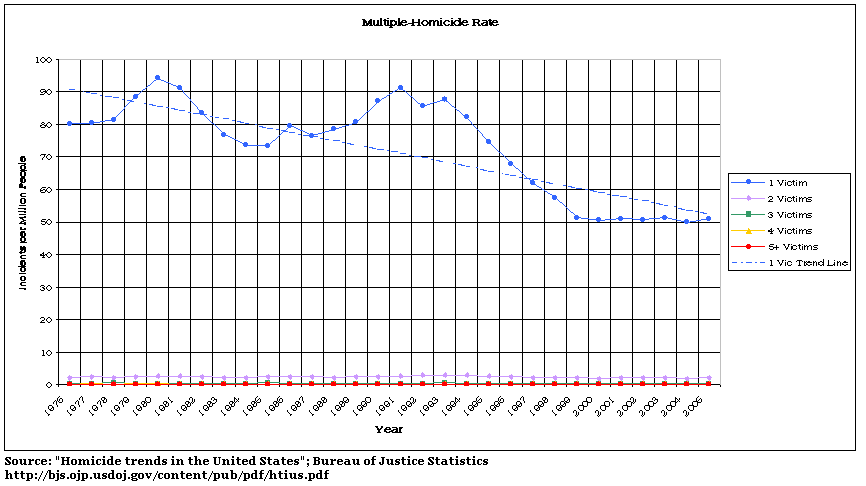
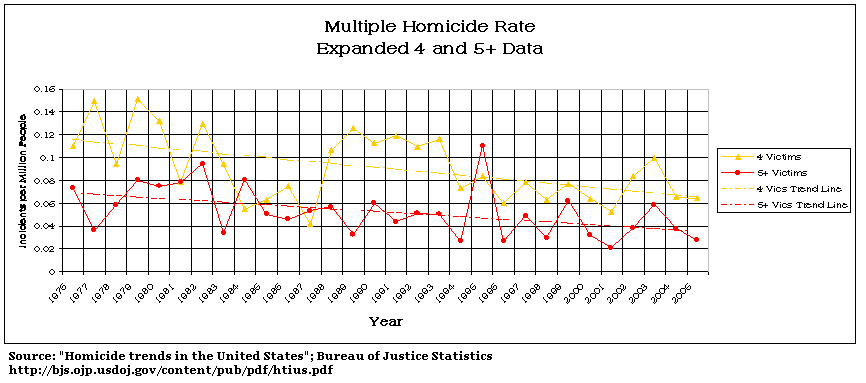
This means that, proportionally, homicides with gun remains steady. If the homicide rate drops by x%, then both gun homicide and "other" homicides also drop by x%. So, why is this surprising? Because if it was gun ownership that was the issue, then you would think that the the ratio of gun murders to non-gun murders would decline! That if the homicide rate dropped by x%, then gun homicide would drop by y% (where y is greater than x) and non-gun homicide rate would drop by z% (where z is less than x). Instead, it's a consistent ratio. This means that the drop in murder is due to less people deciding to commit murder, rather than gun availability or lack thereof.
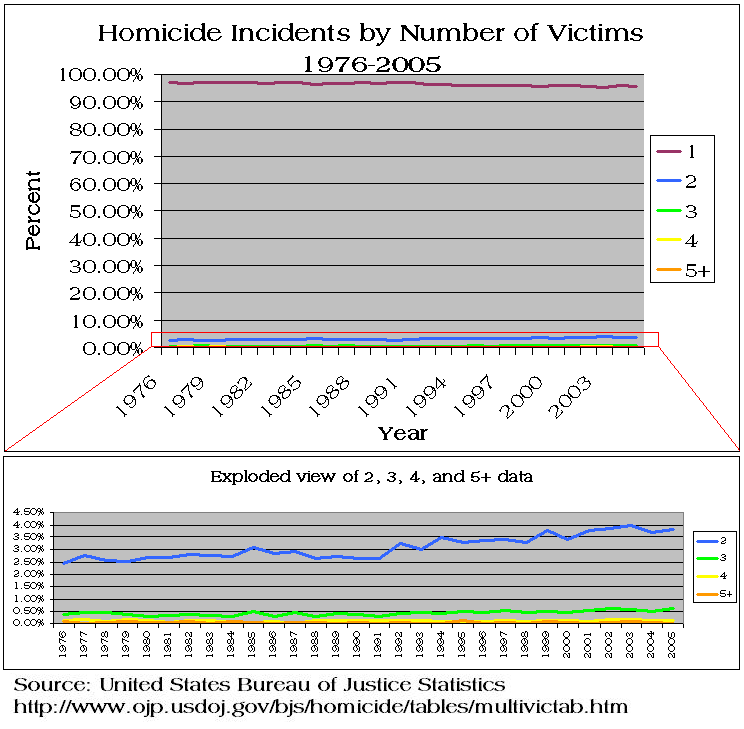
[div class=excerpt style=background:#AFEEEE] I particularly like this one... look at it it. The author is commenting on the "rate" of gun violence (all gun-related deaths) but then "proves" this with a graph that shows the total number of gun-related deaths uncorrected for population.
...as described in a new Center for American Progress report released Friday, if current trends continue, gun deaths will surpass car accident deaths among young people sometime in 2015.
For guns, these numbers represent an enormous failure. The United States has experienced a dramatic decline in violent crime over the last two decades, yet the rate of gun violence, particularly among young people, has barely moved. Why? We don’t know.
This graph puts the lie to the right-wing gun lobby's attempt to use smoke and mirrors to hide the increasing gun death rate behind the misleading "but gun crime rates are falling:"

Yes, this gun death rate includes gun suicides which the gun nuts don't want to count because they "would just find another way." There is a reason that most homicides and suicides are committed with guns: they are easily obtained, they are easy to use, and they are effective at what they do, which is to kill.
In 1999, there were 276,059,000 people (Census Bureau) and 28,847 "gun deaths" (the provided graph). That's 10.45 per 100,000 per year.
In 2011, there were 308,746,000 people (Census Bureau) and 32,163 "gun deaths" (the provided graph). That's 10.42 per 100,000 per year.
There's your "increasing gun death rate". Steady. A difference of .03... downwards.
Of course, suicide by gun is not a violent crime, so while it could be legitimately used to discuss "gun deaths", lumping it together with real violent crimes committed with a gun (robbery, carjacking, homicide, home invasion, etc.) is manipulation. Or lying. If you know that the rate of crimes committed with guns has gone down sharply, but state that it is steady because you count non-crimes in the stats... what is that?
There's a reason this was posted Over There, I guess... didn't want it challenged.
 = new reply since forum marked as read
Highlight:
NoneDon't highlight anything
5 newestHighlight 5 most recent replies
= new reply since forum marked as read
Highlight:
NoneDon't highlight anything
5 newestHighlight 5 most recent replies
NYC_SKP
(68,644 posts)You can protest all you want, and your NRA talking points, you!
Duckhunter935
(16,974 posts)They sure would never allow that discussion over there. I am sure they will be over here any minute to prove your response wrong. More than likely, I expect name calling and insults to be posted in that group.
I fully agree as they block any dissenting views
NYC_SKP
(68,644 posts)And that don't have a zero baseline.
I did the same math that you did before reading all of your post (duh) to find the same result, of course.
A minor decline in gun violence rates.
Whenever they show date on a graph, always check the y-axis for the baseline value, in this case the graph starts at 27,000 and goes to 33,000 and doesn't indicate rates; it indicates total numbers, unadjusted for a growing population.
FFS.

krispos42
(49,445 posts)Because I wouldn't do that without one of those zigzag "break" symbols on the chart and the scale.
See? Y-axis starts at zero here, too.
And here:
More:

And more:
Wow, look at all those crime trends shooting upwards!

virginia mountainman
(5,046 posts)You cannot allow any dissension (or even questions)whatsoever, as it rapidly exposes fatal flaws in the dogma. And it allows the fence sitters, or "soft" supporters to question that since they were wrong on this, and what else could they be wrong about, and once the dogma is exposed for what it really is, it tends to collapse.
The dogma cannot be challenged at all, the dogma cannot be questioned, the dogma must be obeyed,
Following the dogma of gun control is almost like taking Grape Flavor-aid for critical thinking.

blueridge3210
(1,401 posts)their stated purpose: "enact progressive gun control reform". One would think that in order to accomplish that goal one would want to be familiar with the actual facts and data. Yet, actual facts and data seem to be as welcome as holy water at a vampire convention.
Makes you go, "hmmmm".
virginia mountainman
(5,046 posts)You "MUST" deceive.
discntnt_irny_srcsm
(18,479 posts)Shamash
(597 posts)That the most indefensible arguments get posted to a sub-group where the poster will never have to defend it...

ileus
(15,396 posts)guns need banned...there's no debate about it.

petronius
(26,602 posts)'Nugentoid pre-murderer.' Words have meaning, you know... 
beevul
(12,194 posts)Those were the days.
(potential jurors, nobody is calling anyone anything here, this is a reference to a running joke from times past)
needledriver
(836 posts)in the "Gun Extremists" panel of todays favorite Greatest Threads cartoon should actually be pointing downward.
http://www.democraticunderground.com/10026259108
How do you have a dialog with even a well intended opponent of the RKBA when his base assumption is completely wrong?
krispos42
(49,445 posts)The problem is that, to the casual voter this becomes the "truth" because it's the meme that the corporatist media pushes.
The same media that we can't trust on anything else all of a sudden becomes wise and knowledgeable because it's about guns.

jimmy the one
(2,708 posts)krispos: There's a reason this was posted Over There, I guess... didn't want it challenged.... The real reason the crime rate plunged is because of progressive social policy, not progressive or conservative gun policy.
Is that you saying that tailing? if so I agree in part. Also tack on falling gun ownership rates; accd'g GSS and Pew, gun ownership rates, both Household & personal, have dropped approx. 25% from approx. early 1990's. Less guns per capita, then less violent crime rates & murder rates, who'd a thunk?
krispos: if increased medical expertise and reduced 911 response times were a major factor in the reduction of murder, then wouldn't there be a corresponding increase in assault? After all, a failed murder attempt becomes an assault, yes? But we don't see that. The murder rate drops about 40%, as do assaults, rapes, and robbery.
The number of 'failed murders' due to better medical care (falling from murder to aggrasslt/attempted murder as you put it) will statistically be near negligible compared with total number of aggravated assaults. Murder rates about 4 per 100k (on your chart) while aggr assault ~250/100k. Even if a 50% reduction, would add only a couple per 100k, increasing aggr asslt to maybe 252/100k.
krispos: if it was gun ownership that was the issue, then you would think that the the ratio of gun murders to non-gun murders would decline! .. This means that, proportionally, homicides with gun remains steady
No. The ratio of gun murders to non-gun-murders did indeed drop. About 10% from the more prominent drop in gun-murder rates from 1993 to 2000. You make the same error others have made, taking the start point of ~early 90's & the end point of now, ignoring stats in between:
Percent of violence {homicide} involving a firearm, 1993–2011
1993 .. 71.2 %
1994 ...71.4
1995 ...69.0
1996 ...68.0
1997 ...68.0
1998 ...65.9
1999 ...64.1
2000 ...64.4 .. 2001 ...55.9 ... scratch, 9/11 included in totals
2002 ...67.1 2003 ...67.2 2004 ...67.0 2005 ...68.2 2006 ...68.9
2007 ...68.8 2008 ...68.3 2009 ...68.4 2010 ...68.1
2011c ..69.6 http://www.democraticunderground.com/1172151328
ezra's gun ownership graph: http://www.democraticunderground.com/1172155609
(expand link for full thread): Note how the percentage of firearms involved in homicides decreased from 1993 thru 2000, from ~71% down to 64%, about a 10% decline, statistically significant. This is the same time period that household & personal firearm ownership declined 20 -30% accd'g to GSS, gallup, & Pew (even Gallup cites 51% - 34 - 42).
From 2002 thru 2011 the FA ownership & FA hom-rates remained fairly level, avg'g about 68%, an avg decline from 1993/4 of about 5%, not that statistically significant except that, if so, one would've expected a fluctuation above the 1993/4 rate, and there wasn't any. But FA ownership rates also remained fairly steady from 2002-2011.
Crime is down -- and so is gun ownership July 23, 2012.. three important trends to keep in mind: Criminal violence in America has dropped to levels not seen in more than a generation, the percentage of Americans owning guns is down and public support for gun control measures has plummeted as well.
.. the percentage of Americans who report owning a pistol or shotgun, the weapons most often used in crime, is now down to 1 in 5, about half what it was in the 1970s.
The major point is that the American “culture of gun ownership” has been strikingly on the wane for the past generation. http://articles.latimes.com/2012/jul/23/news/la-pn-crime-is-down-and-so-is-gun-ownership-20120722
friendly_iconoclast
(15,333 posts)Year 1991
Population 252,153,092
Aggravated Assaults 1,092,739
Aggravated Assault rate (per 100K inhabitants)
433.4
http://www.fbi.gov/about-us/cjis/ucr/crime-in-the-u.s/2012/crime-in-the-u.s.-2012/tables/1tabledatadecoverviewpdf/table_1_crime_in_the_united_states_by_volume_and_rate_per_100000_inhabitants_1993-2012.xls
Year 2012
Population 313,914,040
Aggravated Assaults 760,739
Aggravated Assault rate (per 100K inhabitants)
242.3
No wonder you defend Michael Belleisles- you share the same approach to verifiable facts
that don't fit your worldview:
http://www.democraticunderground.com/1172161755
jimmy the one
(2,708 posts)icon: Your problem is, aggravated assaults *fell* over the period 1991-2012, both in number and rate
That might be a problem in 'your' mind, but not in mine, since I didn't say otherwise nor hinge anything upon that.
It doesn't matter what aggravated assault rates did or didn't do. I only noted that if krispos was correct (as he is) - that 'murder' morphed moreso into 'attempted murder' due to better medical care for bullet wounds - it would affect aggravated asslt rates negligibly, due to the far greater occurrence of aggravated assault compared with murder.
what I'd said: The number of 'failed murders' due to better medical care (falling from murder to aggrasslt/attempted murder as you put it) will statistically be near negligible compared with total number of aggravated assaults. Murder rates about 4 per 100k (on your chart) while aggr assault ~250/100k. Even if a 50% reduction, would add only a couple per 100k, increasing aggr asslt to maybe 252/100k.
icon: No wonder you defend Michael Belleisles- you share the same approach to verifiable facts that don't fit your worldview:
???? my approach to verifiable facts comports well with reality. Yours, doesn't. You somehow actually thought you'd rebutted successfully what I'd written, when all you did was splash egg on your face with your irrelevant misconception.
Advice:.. review 'Statistics for Dummies', icon, seems your last remedial didn't help at all.
friendly_iconoclast
(15,333 posts)Remember this?
Other factors contributing the reduced gun homicide rate are believed to be increased and improved ER response time and expertise, and vastly improved emergency room facilities and treatment.
Those purported ER cases should have shown up in the 2012 crime survey, yet AA declined
both in number and in rate.
That's a lot of tapdancing to avoid admitting that fewer people are getting shot...
krispos42
(49,445 posts)By pointing this out, of course, you're also undermining the assertion made in the GCRA original post, probably more effectively than I did.
I confess to not following your first paragraph... looks like autocorrect threw up something there. However, the "guns per capita" is at or about steady... while fewer people own guns, the people that do own guns own a higher average number.
As to your third paragraph, I can't think of the any particular reason for the dip during the 2000's you note. One possible reason might be the better medical technology resulting in fewer people dying from gunshot wounds. It would be interesting to see if there was a corresponding increase in the number of "aggravated assault with a firearm" statistics. A 10% decrease in firearm murders should put a few percentage points in the other column, yes?
jimmy the one
(2,708 posts)I prev wrote: Even if a 50% reduction {murder rate}, would add only a couple per 100k, increasing aggr asslt to maybe 252/100k.
krispos replied: By pointing this out, of course, you're also undermining the assertion made in the GCRA original post, probably more effectively than I did.
You're going to have to explain to me 'how' I undermined what bill wrote, when he wrote: Other factors contributing {to} the reduced gun homicide rate are believed to be increased and improved ER response time and expertise, and vastly improved emergency room facilities and treatment.
Bill made no reference to any link between gun-murder rate & aggravated assault, only you did, as far as I saw. He included his above sentence in an overall heading re violent crime, but in the sentence was clearly using murder only as a subset of violent crime.
What I challenged was when you wrote this: >>> nearly three-quarters of all homicides are still committed with a firearm<<< krispos replied: proportionally, homicides with gun remains steady. If the homicide rate drops by x%, then both gun homicide and "other" homicides also drop by x%... if it was gun ownership that was the issue, then you would think that the ratio of gun murders to non-gun murders would decline! Instead, it's a consistent ratio.
I challenged, & demonstrated, that the ratio was not a consistent ratio, but that a correlation existed between declining gun ownership rates & firearm homicide rates, between the most prominent declining years of 1992-2000.
Only thing I'd take issue with bill is: This graph puts the lie to the right-wing gun lobby's attempt to use smoke and mirrors to hide the increasing gun death rate behind the misleading "but gun crime rates are falling.. --- where I think saying 'increasing gun death rate' is invalid, appears just firearm suicide^ slightly (FA accidents^ but negligible overall). Bill's larger point appears that overall firearm deaths are increasing & appear will surpass auto deaths, appears to have inserted rate for total index.
FA suicide rate: 2011: 6.318 2010: 6.2819 2009: 6.11 2008: 5.99
2007: 5.76 2006: 5.66 2005: 5.7519 3 2004: 5.7219
2003: 5.83 2002: 5.95 2001: 5.9219 43 2000: 5.8919
1999: 5.95 1993: 7.35 http://www.gunpolicy.org/firearms/region/united-states
krispos: As to your third paragraph, I can't think of the any particular reason for the dip during the 2000's you note. One possible reason might be the better medical technology resulting in fewer people dying from gunshot wounds.
Of course improved medical technology will result in some relative slight reduction in gun death rate (proportionally as well to overall death), but for your 'medical correlation' hypothesis to hold, it would need hold throughout the entire early 90's to ~2011. My 'gun homicide - gun ownership' correlation roughly holds throughout that time period, especially from 1992/3 to 2000.
You imply improved medical technology as being foremost cause for the reduction in the percent of guns used in homicides, while this is sketchy & cannot be statistically supported, only estimated. You dismiss the reduction in gun ownership rates by saying you can't think of any particular reason for the dip (presume you meant from 1992/3 to 2000).
krispos: It would be interesting to see if there was a corresponding increase in the number of "aggravated assault with a firearm" statistics. A 10% decrease in firearm murders should put a few percentage points in the other column, yes?
Using your figure of a '10% decrease in firearm murders', will result in approx. 1,000 less firearm murders. Aggravated assault with firearm is approx. 20% of total aggr assaults*. Were you then to switch these 1,000 foiled firearm murders to firearm aggravated assault column, you'd increase Aggravated Assaults (using icon's 2012 stat from 760,739 x 20% = ~150,000) from 150,000 to 151,000, a bit over a half percent.
Improved medical technology will generally not significantly affect other violent crime rates. Thus the firearm related FA violent crime rate table I posted, supports my correlation hypothesis between declining gun ownership rates & declining gun violent crime & murder rates.
* rough rule of thumb, 20/40/60 rule; iirc: Firearm aggr asslts = ~20% of total aggr asslts; FA robbery ~40% total robb, FA murder ~60% (up to 64-70% above tho).
jimmy the one
(2,708 posts)Note the dramatic approx 60% drop of nearly one million crimes in firearm violent crime totals from 1993 to 2000 (1.55 million to 0.62 million), the same time period when GSS & Pew & Gallup surveys all contend falling gun ownership rates, falling approx 25% to 30%. The correlation between falling gun ownership rates & falling firearm crime rates cannot be denied using the 3 surveys & the bur justice statistics table, for 1992/3 - 2000.
From 2001 to 2011, GSS & Pew differ from gallup, marginally, as gallup has an increase in gun ownership while GSS & Pew a slight decrease. The rate of firearm crime rate fluctuates up & down about 20% for this time period ~2001-2011:
*(category in table below): Rate of nonfatal firearm victimization
Fatal & Non Fatal FAViol total ... *NFFAV .... rate of violence w firearms
1993 1,548,000 ..................... 7.3 ....................9.2%
1994 1,585,700 ..................... 7.4 ......................9.3
1995 1,208,800 ..................... 5.5 ......................7.9
1996 1,114,800 ..................... 5.1 ......................7.9
1997 1,037,300 ..................... 4.7 .......................7.7
...1998 847,200 ..................... 3.8 .......................7.0
...1999 651,700 ..................... 2.9 .......................6.1
...2000 621,000 .................... 2.7 .......................7.3
...2001 574,500 ..................... 2.5 .......................7.7
...2002 551,800 ..................... 2.3 ........................7.4
...2003 479,300 ..................... 2.0 ........................6.2
...2004 468,100 ......................1.9 ........................6.9
...2005 515,900 ..................... 2.1 .........................7.4
...2006 627,200 ..................... 2.5 .........................7.4
...2007 567,400 ..................... 2.2 .........................8.3
...2008 383,500 .............. .......1.5 .........................6.0
...2009 421,600 ..................... 1.6......................... 7.4
...2010 426,100 ..................... 1.6 .........................8.6
..2011d 478,400 ..................... 1.8 ........................8.2

Pew Research Center has tracked gun ownership since 1993, and our surveys largely confirm the General Social Survey trend.

Nuclear Unicorn
(19,497 posts)Yet, the number of guns owned is at an all time high that would seem to indicate the number of guns per gun-owning household is increasing even if the number of gun-owning households is decreasing.
friendly_iconoclast
(15,333 posts)...yet at the same time one of our resident controllers states above that violent firearm crime rates
have dropped even faster than reported rates of gun ownership:
http://www.democraticunderground.com/1172161439#post17
Note the dramatic approx 60% drop of nearly one million crimes in firearm violent crime totals from 1993 to 2000 (1.55 million to 0.62 million), the same time period when GSS & Pew & Gallup surveys all contend falling gun ownership rates, falling approx 25% to 30%.
Both these things cannot be true.
Nuclear Unicorn
(19,497 posts)It's the fact we give them as much rope as they think they need.
friendly_iconoclast
(15,333 posts)...and half-truths when we find them...

oneshooter
(8,614 posts)I just picked up a nice 1918 dated Lithgo SMLE with the mag cut off still on it.
Does that make me more violent, or less?
friendly_iconoclast
(15,333 posts)However, it *is* still both a "deadly sniper rifle" and "of military design", so be ready
to hand it over to the confiscation squad, mmkay?
friendly_iconoclast
(15,333 posts)If the statistics you cite are true it would mean that the average gun owner
has become less dangerous, not more- even while owning more guns...
jimmy the one
(2,708 posts)icon the con: Wait a minute! The controllers here tell us that people owning multiple firearms is a bad thing.
Icon next takes out of context what I wrote in 2013: ..I didn't see anything about the 'number' of guns owned or in the household. I think this plays a big part, the more guns in the house the more likely the chance of using one inappropriately
In context, what I wrote in 2013: .. I think this plays a big part, the more guns in the house the more likely the chance of using one inappropriately or having it misplaced in the home, stolen etc (esp for young families)..
icon continues his con: ..yet at the same time one of our resident controllers {jimmy the one} states above that violent firearm crime rates have dropped even faster than reported rates of gun ownership: Both these things cannot be true
Duh, icon the con artist, since when does 'using firearms inappropriately' or having them misplaced or stolen or misused by kids, equate to violent crime rates?
Your stupid reasoning makes me sick.
icon: If the statistics you cite are true it would mean that the average gun owner has become less dangerous, not more- even while owning more guns...
What a total non sequitur.
The more guns there are in America the more likely they will be used inappropriately, whether lost in the house or shooting at stop signs or stolen or whatever, not just being used in violent crime. You confuse usage in violent crime with being the sole reason for inappropriate usage of firearms, thus maliciously twisting about what I wrote in 2013.
You have the integrity of a sailboat with a hole in the hull. Blowing in the wind & sinking.
jimmy the one
(2,708 posts)icon: Those purported ER cases should have shown up in the 2012 crime survey, yet AA declined both in number and in rate.
Am I writing in invisible ink? how can you miss such simple things I write, like how much affect any 'foiled gun murders' will have on aggravated assaults?
You icon yourself posted the figures Year 2012 Aggravated Assaults 760,739 , for some reason posting total aggravated assaults (which demonstrates your sophomoric approach to most all of what you pretend to be knowledgeable about).
To tack on even 1,000 foiled gun-murders onto the aggravated assault total of 760,739 would increase it to 761,739, making a negligible percentage increase, while tacking on 1,000 to a more plausible 150,000 firearm related aggravated assaults would mean approx. 0.7% increase, which won't be significant in itself, as well as due to normal yearly fluctuations.
icon:That's a lot of tapdancing to avoid admitting that fewer people are getting shot...
What a stupid childish remark, prompted by your own ignorant premise.
friendly_iconoclast
(15,333 posts)...and don't have time to read mass quantities of bafflegab