2016 Postmortem
Related: About this forumThe past 20 years were better for poor and middle class Americans than the 20 years before that
https://www.census.gov/hhes/www/income/data/historical/families/Tables from that link. All numbers in 2014 dollars.
The bottom quintile line for household income (remember this is all adjusted for inflation to 2014 terms) in 1974 was $29050.
In 1994 it was $28362, representing a $688 or 2.3% loss from 1974.
In 2014 it was $29100, representing a $738 or 2.6% increase from 1994.
The second quintile line in 1974 was $47462.
In 1994 it was $49482, representing a $2020 or 4.2% increase from 1974.
In 2014 it was $52697, representing a $3215 or 6.5% increase from 1994.
The third quintile line in 1974 was $67424.
In 1994 it was $74303, representing a $6879 or 10.2% increase from 1974.
In 2014 it was $82032, representing a $7729 or 10.4% increase from 1994.
The past 20 years have been much better for working Americans than the 20 years before that were.
And here's what's really interesting: look at the percent of households that were one-earner or two-earner in each of the following years:
1954: 52.5% of households had 1 earner, 32.2% had 2 earners
1974: 34.0% of households had 1 earner, 38.8% had 2 earners (already by 1974, two earners was more common than 1)
1994: 28.1% of households had 1 earner, 45.6% had 2 earners
2014: 33.1% of households had 1 earner; 40.5% had 2 earners
So what's really interesting about that is that the larger gains from 1994 to 2014 were in the context of fewer households having two adults working, and more households having one adult working.
 = new reply since forum marked as read
Highlight:
NoneDon't highlight anything
5 newestHighlight 5 most recent replies
= new reply since forum marked as read
Highlight:
NoneDon't highlight anything
5 newestHighlight 5 most recent replies
Human101948
(3,457 posts)I calculate that the top quintile increased their take by 94 percent in the past 20 years..
You seem to think those two data would be in conflict; they aren't. The increased gains to the top 5% have been simultaneous with improved income growth for the bottom 20%, 40%, and 60%.
Again: real incomes for the poor and middle class grew more over the past 20 years than they did in the 20 years before that. Is that a bad thing to you?
Human101948
(3,457 posts)The "gains" that have accrued to the lower quintiles are insignificant.
And the inflation calculations are a joke.
Additionally, over the past 30 years, the government has changed the way it calculates inflation more than 20 times. These ‘methodological improvements’ to the CPI are said to give a more accurate measure of consumer prices. However, these changes could also be a convenient way to include or exclude certain products that give favorably low results, but there’s no way to know, given the lack of transparency.
http://www.forbes.com/sites/perianneboring/2014/02/03/if-you-want-to-know-the-real-rate-of-inflation-dont-bother-with-the-cpi/#c539503118b7
Wow. That's easy for you to say. Why do you care what the top 5% are making when the bottom 20% are finally reversing the 20 year loss they suffered between 1974 and 1994? Would you go back to the 1974-1994 incomes for the top 5% if it also meant giving the bottom 20% a similar paycut again?
And the inflation calculations are a joke.
Ah, an inflation truther. Nevermind

Human101948
(3,457 posts)You can quote all the statistics you want.

uponit7771
(90,347 posts)
Recursion
(56,582 posts)Those numbers are what actually happened.
merrily
(45,251 posts)Recursion
(56,582 posts)merrily
(45,251 posts)Does any government COLA reflect the actual cost of living?
Did LBJ tell the truth about Vietnam?
Yes, I believe government agencies and officials mask reality. Don't you?
LanternWaste
(37,748 posts)What then is the specific reality, and from what "believable", peer-reviewed and objective sources is that based on?
Logical
(22,457 posts)uponit7771
(90,347 posts)... they claim the QEs would bring us inflation out of this world and since they're proven wrong they just make shit up
Human101948
(3,457 posts)As truthful as your baseless accusation.
Ask anyone on a fixed income if they have the same or better purchasing power than 20 years ago...I don't think they will agree with you.
uponit7771
(90,347 posts)... left.
Podium birds and angry people capture more attention than reality
Human101948
(3,457 posts)and their reasoning and logic. Of course, it is that alternate reality that Karl Rove constructed. I expect the Hillary center right reality will collapse in a similar fashion.
uponit7771
(90,347 posts)... they usually go into ad homs.
Human101948
(3,457 posts)you're still just spouting hogwash.
uponit7771
(90,347 posts)
snowy owl
(2,145 posts)That's the problem with these uninformed believers-of-crap without understanding relevant influences and numbers.

tblue37
(65,442 posts)for much that used to be funded by taxes--like busing kids to school in the city I live in. Parents now must pay for such school suppliies as tissues and blackboard chalk that schools always provided for classrooms in the past.
As individuals we are being nickle and dimed through fees for costs that used to be spread across the entire taxpaying population.
Human101948
(3,457 posts)of the many things that are not accounted for in government inflation reports.
Oh, that and "lifestyle changes." When filet mignon gets too expensive they just substitute dog food in the market basket.
But these mavens have the statistics to prove without a doubt that we are better off than 20 years ago.
1939
(1,683 posts)that schools still used backboards and chalk.
tblue37
(65,442 posts)vintx
(1,748 posts)Last edited Fri May 6, 2016, 07:27 AM - Edit history (1)
Housing, education, healthcare, etc.
It also leaves out the massive gap which indicates that all the benefits of automation and efficiency are sucked up by those at the top.
Recursion
(56,582 posts)(Assuming you meant "costs", not "coats".)
Real dollars are calculated by factoring in the cost increases of things like housing, food, education, healthcare, communication, energy, etc. (BLS publishes a big list of all the things that go into it).
It also leaves out the massive gap which indicates that all the benefits of automation and efficiency are sucked up by those at the top.
Except, they obviously aren't, because again the bottom three quintiles saw higher income increases between 1994 and 2014 than they did between 1974 and 1994. So the data contradict your theory.
vintx
(1,748 posts)as the BLS method for calculating unemployment.
By design.
At one point most people on DU seemed to be aware of this.

What this study really shows is the change in CPI methodology that started under Reagan and radically transformed the calculation by the end of Clinton's 2nd term. This is a perfect example of why there is such deep distrust of government overall but of the financial games played by it in particular.
Classic "piss on your head and tell you its raining" philosophy. If the numbers say things are better, the numbers are simply wrong.
Www.shadowstats.com
B Calm
(28,762 posts)Recursion
(56,582 posts)Logical
(22,457 posts)Downwinder
(12,869 posts)
Doremus
(7,261 posts)That show the declining wages of the bottom 80% since the 70s. Mother jones has them but I can't paste the URL from this tablet.
Just as we'll anyway. It's silly to waste time refuting such obvious nonsense.
Recursion
(56,582 posts)Umm... OK...
Recursion
(56,582 posts)These numbers are actual working people's money. And they saw more of it after 1994 than they did before it.
Downwinder
(12,869 posts)Ten years ago I could operate a motorcycle.
Now I walk.
cali
(114,904 posts)Recursion
(56,582 posts)Is Census wrong?
Loudestlib
(980 posts)We have not recovered from 2008. Only the 4th teir and the top 5%. You are correct, this is a crap post.
Jitter65
(3,089 posts)telling them that they are worse off. The people who were living and working over the past 40 years know the difference though many have forgotten because they have bought into the brainwashing. The millennials only know what they are told by the same folks. It is an up-hill battle. Blacks know the difference because they, unlike others, never had the privilege of white skin. If you have lived under oppression, depression, disenfranchisement most of your life, your historical memory is more in tact. You can even pretend to not remember but in your gut you do.
For example, the people who suffered the most during the great depression remember it best and deeper and they have a greater appreciation for the years following when Social Security and Medicare and the like were introduced and passed. Thus, the memory of rising out of poverty and into the middle or in some cases the upper middle and wealthy class is more ingrained in the minds of many blacks whose ships rose during the 1990's. And those who received help with Affirmative Action during the late 60's and early 70's also remember the biggest employer of equal opportunity jobs...the Federal government. If you want to know why there is fondness for all things government...that's your clue. State governments followed suit and laws were passed and ENFORCED in Federal and State governments that made discrimination based on race illegal. Private sector...not so much.
We are not so easily led to believe in the evil of government...historical memory doesn't allow it...though some may pretend it doesn't exist.
Recursion
(56,582 posts)It may also be meaningful that African Americans saw much larger relative income increases in the 1990s than whites did (even though they didn't "catch up", as it were).
Jitter65
(3,089 posts)Kentonio
(4,377 posts)Than any other demographic. A generation of wealth swept away and the opportunity to gain it back increasingly diminishing.

My Good Babushka
(2,710 posts)because how else will they know how good they have it? Don't just sit here typing it! Like David Brooks, you better "go out into the pain" with your good news.
In the U.S., starting in the 1930s, relative poverty rates have consistently exceeded those of other wealthy nations.
In 2009 the number of people who were in poverty was approaching 1960s levels that led to the national War on Poverty. In 2011 extreme poverty in the United States, meaning households living on less than $2 per day before government benefits, was double 1996 levels at 1.5 million households, including 2.8 million children.
Recent census data shows that half the population qualifies as poor or low income, with one in five Millennials living in poverty. Academic contributors to The Routledge Handbook of Poverty in the United States postulate that new and extreme forms of poverty have emerged in the U.S. as a result of neoliberal structural adjustment policies and globalization, which have rendered economically marginalized communities as destitute "surplus populations" in need of control and punishment.
In 2011, child poverty reached RECORD HIGH LEVELS, with 16.7 million children living in food insecure households, about 35% more than 2007 levels. A 2013 UNICEF report ranked the U.S. as having the second highest relative child poverty rates in the developed world.
vintx
(1,748 posts)It's sad how often cooked statistics are used to try to fool people into thinking things are better than they are.
Recursion
(56,582 posts)
Furthermore, the child poverty level is lower today (21.1%) than it was in 1993 (22.7%).
https://www.census.gov/hhes/www/poverty/data/historical/hstpov3.xls
(That's a spreadsheet, as a warning)
My Good Babushka
(2,710 posts)who've enduring years of 1%-2% raises whilst their bills and expenses have gone up by 40-60%, and saying "whatsa matter, you don't like your raises?" It's disingenuous and kinda Trumpy. People are working longer for less, less home ownership, less savings, less ability to retire with any kind of decent standard of living. Less options all around.
Recursion
(56,582 posts)Except they aren't. First off, hours worked annually have been falling, not rising:
https://stats.oecd.org/Index.aspx?DataSetCode=ANHRS
Secondly, as the census data in the OP show, incomes have increased over the past 20 years, adjusted for cost of living, at a greater rate than they did in the 20 years before that.
My Good Babushka
(2,710 posts)the work isn't accumulating into anything like middle class security or savings, less or more hours, workers are lucky to tread water.

vintx
(1,748 posts)than 'America is already great'
Waving statistics at voters and asking them to just BELIEVE the statistics and not their own experience is not going to fly.
Loudestlib
(980 posts)How about the poverty rate for 18-64?
Recursion
(56,582 posts)We have more poverty in that age group, and less among children and seniors. I'd assume that's because AFDC was replaced with TANF.
Loudestlib
(980 posts)The teen birth rate (the largest group having children in poverty) had a birth rate of ~58 in 1993. It is now 24.2. There is your .6 %. PRWORA did nothing to address wages, the result is a 1.1 % increase in poverty for most people. It was a failure.
http://www.hhs.gov/ash/oah/adolescent-health-topics/reproductive-health/teen-pregnancy/trends.html

99Forever
(14,524 posts)There are lies, damn lies, and statistics.
Recursion
(56,582 posts)What do you dislike about families seeing a higher income increase in the past 20 years than they did in the 20 years before that?
merrily
(45,251 posts)Recursion
(56,582 posts)That's lazy, and I'm not going to apologize for calling it out.
Bluenorthwest
(45,319 posts)data and statistics can be and often are manipulated and presented in less than honest manners, just the exact same way language can be presented with agenda. It is a point worth making because your entire sermon here is based on 'data' as a sacred thing, but that data is not sacred, it's a tool of agenda, and the agenda is yours.
Your argument here, repeatedly is 'I am right because I am using numbers' and that is of course laughable and requires a response.
Recursion
(56,582 posts)In the past 20 years than in the 20 years before that.
There's not really any wiggle room there: they are. How could I present those data "misleadingly"?
Bluenorthwest
(45,319 posts)have more? None of it, there is no data that offers you that standing. Using that emotional, personal and fully not statistical attack on that poster is part and parcel of how you present your arguments in a less than honest manner. I did not, by the way, use the word you have quotation marks around suggesting that I used it. "Misleadingly" is your word. So why use those quotation marks? It's less than honest.
But the real issue is the how, not the what. Attacking others in that manner is not acceptable. I'm sure that to many readers you sound utterly dismissive of those who have less than you do, and it would not be fair to say that sort of thing to you either.
Recursion
(56,582 posts)Why not just admit we're doing some things right?
Bluenorthwest
(45,319 posts)chosen verbiage. Try answering my question about why you employ quotation marks when you are not quoting me. Those tactics, as I said, are part of how you emotionalize your argument while also claiming your argument is pure data. Good honest data does not need to be sold with snark and insults, does it? No it does not. So when I see snark and insults being called 'the data' I will point out that the snark is superfluous to the data.
If your argument is 'I use pure data' then you must avoid polluting your data with cheap sarcasm based on things you could not know about the other poster. You introduced faith based assumption while shouting 'statistics'. That's not reason, it's not logic. It's emotion.
merrily
(45,251 posts)Besides, as several of my posts on this thread have said, his post was necessarily not off the mark.
Recursion
(56,582 posts)merrily
(45,251 posts)with "lazy?" Wow!
Recursion
(56,582 posts)I'm actually curious what he dislikes about it, and why seeing that makes him defensive rather than happy.

Fumesucker
(45,851 posts)Housing, medical and food costs on the other hand are soaring.
I can do without the latest gadget, he typed on an eight year old computer, but I can't do without housing, medicine and food.
Recursion
(56,582 posts)The entire BLS and Census Bureau did their best and just got it completely wrong?
Fumesucker
(45,851 posts)Recursion
(56,582 posts)1939
(1,683 posts)and if we can't get it, we feel economically deprived.
1974 I had a slide rule (calculators were too expensive then). Today, i have four desktops and three laptops in the house.
1974, I had one 19" TV. Today I have TVs (some quite large) in every room of the house.
1974, I had a combined radio/phonograph in the living room. Today I have numerous iPods and iPads with speaker stands.
1974, I had a phone in the kitchen and a phone in the master bedroom. Today, I have phones in every room of the house and two cell phones.
1974, my car had an AM radio. Today I couldn't begin to tell you what all the "media systems" in our cars will do.
So possibly the increases that Recursion has pointed out have been eaten up by greater expectations.
Response to Recursion (Reply #24)
Post removed
Logical
(22,457 posts)YouDig
(2,280 posts)Reminds me of right-wingers when you show them those temperature graphs.
merrily
(45,251 posts)huge difference between swallowing one set of numbers Recursion posts whole and rejecting what almost every scientist says about global warming and denying the ice cap is melting and once heavily snow capped mountains are no longer snow capped. Equating those two is what strikes me weird.
YouDig
(2,280 posts)Despite the increase in single earner households.
merrily
(45,251 posts)explanation, which the OP did not give.
Does the income increase reflect real purchasing power or is it only a dollar increase?
Recursion
(56,582 posts)Because it doesn't matter; what matters is that despite one-earner households becoming more common over the past 20 years, household incomes have gone up, more than they did in the 20 years before that.
Does the income increase reflect real purchasing power or is it only a dollar increase?
Those are constant 2014 dollars, meaning they reflect purchasing power.
merrily
(45,251 posts)not increased appreciably since the 1970s then?
See, I was a partner in a firm and I KNOW Reply 22, which you called lazy, could not be more on the money (no pun intended).
Recursion
(56,582 posts)I picked 1994 and 1974 from a table that goes back to the 1940s. The nominal dollars are converted into 2014 dollars.
merrily
(45,251 posts)purchasing power has not increased appreciable since the 1970s?
Nominal dollars from when to 2014? AFAIK, it's always a comparison of one period with another, not "all years.
Besides, if this is a referendum on the Clinton Administration, we should think about 2008, not 2014.
Recursion
(56,582 posts)At least for the poorest Americans. The end result was basically a wash (a 2.4% drop and a 2.6% increase don't make much overall difference).
AFAIK, it's always a comparison of one period with another, not "all years.
Huh?
The table goes from 1947 to 2014. It lists in current (nominal) dollars the actual dollar amount of incomes for each year. It then calculates for each year the equivalent of that current dollar value in 2014 dollars. That "2014 dollars" value is what I'm using, because nominal dollar comparisons aren't very useful. I'm sure you've seen that done a lot, right?
merrily
(45,251 posts)Recursion
(56,582 posts)But since this primary is to some extent a referendum on the economy of the past 20 years, I didn't.
merrily
(45,251 posts)even the last 20 years didn't end in 2014.
merrily
(45,251 posts)showed more wealth had gone to the top--and faster--during Obama's administration than ever before.
And certainly ending "welfare as we know it" could not have done much for the poor. Maybe it did a lot for sites like GoFundMe, but, other than that....
Recursion
(56,582 posts)Why do you care what the top 5% are doing, if the bottom 20% are seeing gains over the past 20 years after seeing losses for the 20 years before that?
Would you "trade"? Would you be willing to see 1974-1994 wage losses for the bottom 20%, if it reversed the total inequality back to 1974-1994 levels? Why do you care?
merrily
(45,251 posts)hurting anyone else. Also what you are claiming is not contrary only to what Manny posted. It's contrary to most things I've read in the past ten or fifteen years and to the experience of people I know. So color me skeptical on both counts (no pun intended).
Fumesucker
(45,851 posts)One's position in society is a relative thing, if yours is going up less quickly than that of those at the top then you are losing ground socially and your influence will be ever less.
No one likes feeling more and more powerless except perhaps certain sorts of masochists.
Recursion
(56,582 posts)There's a keeping up with the imaginary Joneses aspect here.
Fumesucker
(45,851 posts)As decisions more and more are made by those with the excess money to influence decisions those decisions less and less reflect to the benefit of the common person.
Jimmy Carter admits it, why is it so difficult for you?
Recursion
(56,582 posts) Yes, though, the dismantling of that illusion is painful.
Fumesucker
(45,851 posts)I recommend you go with that...
Recursion
(56,582 posts)I'm left deciding which of the dregs is better...
Fumesucker
(45,851 posts)You manage to sound a great deal like an apologist for the status quo.
Frankly the way I see the modern Democratic party is many of them think it's perfectly OK for people to starve in the streets out of sight out of mind as long as the people starving are demographically similar to the wealthy.
Recursion
(56,582 posts)to the increase in poverty between 1974 and 1994. Don't you?
Fumesucker
(45,851 posts)
Nye Bevan
(25,406 posts)Kentonio
(4,377 posts)It's about a system where the hard efforts of American workers are increasingly funneled to a tiny elite, while people working multiple jobs are still reliant on government aid to help them with luxuries like keeping a roof over their heads and food in their childrens mouths. America has gone from a country where a low income worker could support a family on their wage, to one where both parents can be working multiple jobs and only just getting by.
Recursion can pull as many government stats as he likes, but the reason there is so much anger in this thread is because people living at that part of the income scale know the lie when they see it. The lie that says nothing is wrong when their livelihoods are hanging by a thread, the lie that says the economy is growing as their jobs are disappearing to Asia, the lie that says its all just envy towards those rich folks who just work harder than the guy working 16-18 hour days of hard manual labour to feed his kids.
My Good Babushka
(2,710 posts)gives those people the power to shape the entire economy for everyone else in it. They make the rules about infrastructure, utilities, working conditions, energy initiatives, our trade policies, and who we are going to war with next. Everyone else just lives here. Where money is speech, you can only have the democracy that you can afford.
CentralMass
(15,265 posts)had a poverty rate this low since the Civil Rights Era.
Minorities and their children are particularly hard hit. 42.5% of Hispanic children and 38.5% of African American children are living in poverty. I think it was around 19.5 or 20% of white children living on poverty.
Recursion
(56,582 posts)As is the child poverty rate.
https://www.census.gov/hhes/www/poverty/data/historical/people.html
My Good Babushka
(2,710 posts)That is FUCKING SHAMEFUL. No matter what numbers came before it.
Recursion
(56,582 posts)My Good Babushka
(2,710 posts)https://www.washingtonpost.com/news/wonk/wp/2014/10/29/child-poverty-in-the-u-s-is-among-the-worst-in-the-developed-world/
http://www.nccp.org/topics/childpoverty.html
http://www.usatoday.com/story/news/nation/2015/07/20/more-children-living-poverty-now-than-during-recession/30415391/
http://america.aljazeera.com/articles/2015/7/21/report-suggest-us-children-left-behind-in-economic-recovery.html
If you went to shareholders meeting (re: gains of the lowest quintile earners) and said in 40 years you've managed to gain a .3% increase in profits, and act like that is some kind of laudable accomplishment, you'd get sacked on the spot.
This whole wheedling, apologia for the oligarchs is garbage.
Recursion
(56,582 posts)The child poverty rate is always higher than the total poverty rate, unfortunately.
(And before you ask, yes: that's too high, but the fact that it has gone down is good, not bad.)
CentralMass
(15,265 posts)On this day in 2000 there were 32.2 million living in poverty. In 2008 there were 38.2 million. Today there are 46.8 million. The child poverty rate in a country with this wealth is appalling and unacceptable
Recursion
(56,582 posts)The past 8 years have been bad, but it hasn't undone even most of the gains of the past 20 years.
CentralMass
(15,265 posts)There has been no obvious focus on the issue of poverty by the party or President. It is not politically advantageous to talk about it or elevate to the top of the in-box.
Jitter65
(3,089 posts)merrily
(45,251 posts)Recursion
(56,582 posts)
raging moderate
(4,307 posts)Things improved somewhat during the Clinton years. I remember an episode in which George W. Bush was asked by someone in a crowd, "Don't you think that Bill Clinton had something to do with the improvement in the employment situation?" and Dubya intoned in that bland voice, "No, I think you did it, you, the working people of America." Astonishingly, a lot of people bought this nonsense and voted the Bush/Cheney regime into office. Then, things got worse overall, culminating in the Great Crash/Great Recession of 2007-8. Then Obama got elected, and the Republicons started trying to pretend the Recession had been Obama's fault. Luckily, they made some mistakes. I remember Dubya on some new show, right after Obama had taken office, claiming loudly, "My administration created 40,000 jobs every month" because he didn't even know just how LOW that figure actually was. The Obama Administration has done many good things to stimulate the economy, and monthly job creation is several times the number Bush claimed for his administration during that interview. So things have been up and down. It has been a mixed bag. And corporations have sometimes helped and sometimes hurt the economy as it affects people not in the top 1%. Lots of people really were wiped out during that Great Recession of 2007-8, and corporate policies like not hiring people who had been unemployed a long time and keeping minimum wages too low to live on and pretending that the problem was lazy people sponging off food stamps and foreclosing mercilessly on people who couldn't make the mortgage payments did not help. Obama has made herculean efforts, and his Administration has done many good things. Top US financiers, however, have continued their relentless drive to take most of the profits produced by US workers and gradually reduce the rest of us to the status of most of the workers in the "Third World." I want the workers of India and other places to get more money. I just do not believe that US workers have to accept serf status to achieve that. I am glad that Black people and others have overall have higher incomes relative to whites than they did when I was a child. I just think that we should work together to get the top 1% to pay their fair share of the taxes. And they could learn to treat us all with a little more respect. I was glad when Obama stood up to the corporations a little, and told them he was all that was standing between them and the pitchforks. I understand that real life requires more subtle negotiations most of the time, with some inevitable concessions. However, I want my government of the people, by the people, and for the people to keep reining in these pampered little snobs as much as possible, rather than fueling their narcissistic fantasies of continual conquest and empire.
Recursion
(56,582 posts)And pointing out that the past two decades have seen bigger income increases for poor Americans than the two decades before them did. I didn't say a word about policies or administrations.

newblewtoo
(667 posts)in speaking a bit of truth to those who only want to see the dark lining of every cloud in the sky. Some are convinced every positive piece of news is a new conspiracy theory on behalf of a corrupt government lead by evil opposition forces. Just because a fact doesn't fit one's personal circumstance does not mean it is not a fact.
It is true that you can torture any piece of data and get it to say what ever you like. Recursion has not done that here. As Sargent Friday use to say it's "Just the facts ma am, just the facts."
forjusticethunders
(1,151 posts)The potential flaw in the numbers is that averages can create false correlations that don't capture a full of picture of reality.
For example, most of those 2nd and 3rd quintile jobs are concentrated in urban or at least exurban locales. Areas with very very high cost of living. Therefore, while the aggregate cost of living may not have gone up, the cost of living in a place that gives you access to a decent job HAS gone up. Similarly, the places with relatively low cost of living also don't have the kind of access to jobs that allow those people to see the benefit of that cost, or to feel what those statistics imply, which is that things have actually gotten better.
So in short, while the economic aggregates seem to support your thesis, I would respond that this kind of aggregation may be masking an uneven relationship between income and cost of living.
Also one thing the data masks is that POC have won real improvements in wealth (granted a lot of it was lost in the Great Recession) while white people particularly males have stagnated (this is something you've pointed out repeatedly btw) but my response is that as much as the white working class is largely being punished for selling itself out by voting Nixon/Reagan/Bush x2, the data is largely showing that we're splitting the difference between the wage suppression and economic precarity experienced by POC under Jim Crow, and the economic security experienced by white workers in the same difference, which is far, far less than ideal compared to the idea of having all classes with a high level of economic security. If worker pain/insecurity was a 10 point scale, the white worker in 1950 would be at a 1, and the black one at a 10. Now we've split the difference to make them both 5, which is certainly more fair, but the goal should be to make both of them 1.

islandmkl
(5,275 posts)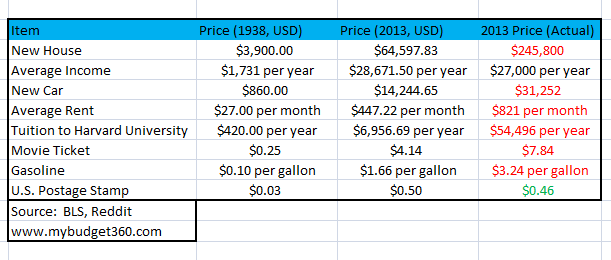
whatthehey
(3,660 posts)Here's an example of how scary house price glurge can be deceptive...

Logical
(22,457 posts)Because you are looking silly now!
Logical
(22,457 posts)Loudestlib
(980 posts)We have not recovered from 2008. Only the 4th tier and the top 5%. This is a crap post.
Recursion
(56,582 posts)That's the point. Despite the great recession, American workers gained more ground over the last 20 years than in the 20 years before that.
Loudestlib
(980 posts)That's not gaining ground.
Recursion
(56,582 posts)They lost $688 between 1974 and 1994.

bkkyosemite
(5,792 posts)Logical
(22,457 posts)whatthehey
(3,660 posts)There are people doing poorly now. There were people doing poorly then, but as the data show, slightly fewer and slightly less poorly now.
Logical
(22,457 posts)
Marrah_G
(28,581 posts)Recursion
(56,582 posts)
angrychair
(8,717 posts)If you look here
Under "Distribution of Household Income" and "US Census Bureau figures for 2014"
It has 29% of households making less than $28,000 a year.
From your provided link in OP, we see the mean income for the bottom quintile (in 2014 dollars) is $16,110. In 1994 the mean was $16,421 (2014 dollars) and in 1974 it was $18,191.
Your premise appears to be cherry-picking the most favorable numbers possible.

Octafish
(55,745 posts)
by Paul Buchheit
Published on Monday, December 30, 2013 by Common Dreams
Anyone reviewing the data is likely to conclude that there must be some mistake. It doesn't seem possible that one out of twenty American families could each have made a million dollars since Obama became President, while the average American family's net worth has barely recovered. But the evidence comes from numerous reputable sources.
Some conservatives continue to claim that President Obama is unfriendly to business, but the facts show that the richest Americans and the biggest businesses have been the main - perhaps only - beneficiaries of the massive wealth gain over the past five years.
1. $5 Million to Each of the 1%, and $1 Million to Each of the Next 4%
From the end of 2008 to the middle of 2013 total U.S. wealth increased from $47 trillion to $72 trillion. About $16 trillion of that is financial gain (stocks and other financial instruments).
The richest 1% own about 38 percent of stocks, and half of non-stock financial assets. So they've gained at least $6.1 trillion (38 percent of $16 trillion). That's over $5 million for each of 1.2 million households.
The next richest 4%, based on similar calculations, gained about $5.1 trillion. That's over a million dollars for each of their 4.8 million households.
The least wealthy 90% in our country own only 11 percent of all stocks excluding pensions (which are fast disappearing). The frantic recent surge in the stock market has largely bypassed these families.
2. Evidence of Our Growing Wealth Inequality
This first fact is nearly ungraspable: In 2009 the average wealth for almost half of American families was ZERO (their debt exceeded their assets).
In 1983 the families in America's poorer half owned an average of about $15,000. But from 1983 to 1989 median wealth fell from over $70,000 to about $60,000. From 1998 to 2009, fully 80% of American families LOST wealth. They had to borrow to stay afloat.
It seems the disparity couldn't get much worse, but after the recession it did. According to a Pew Research Center study, in the first two years of recovery the mean net worth of households in the upper 7% of the wealth distribution rose by an estimated 28%, while the mean net worth of households in the lower 93% dropped by 4%. And then, from 2011 to 2013, the stock market grew by almost 50 percent, with again the great majority of that gain going to the richest 5%.
Today our wealth gap is worse than that of the third world. Out of all developed and undeveloped countries with at least a quarter-million adults, the U.S. has the 4th-highest degree of wealth inequality in the world, trailing only Russia, Ukraine, and Lebanon.
3. Congress' Solution: Take from the Poor
Congress has responded by cutting unemployment benefits and food stamps, along with other 'sequester' targets like Meals on Wheels for seniors and Head Start for preschoolers. The more the super-rich make, the more they seem to believe in the cruel fantasy that the poor are to blame for their own struggles.
President Obama recently proclaimed that inequality "drives everything I do in this office." Indeed it may, but in the wrong direction.
FORUM HOSTS, PLEASE NOTE: This work is licensed under a Creative Commons Attribution-Share Alike 3.0 License.
Paul Buchheit is a college teacher, an active member of US Uncut Chicago, founder and developer of social justice and educational websites (UsAgainstGreed.org, PayUpNow.org, RappingHistory.org), and the editor and main author of "American Wars: Illusions and Realities" (Clarity Press). He can be reached at paul@UsAgainstGreed.org.
Original Article: http://www.commondreams.org/view/2013/12/30-0
That was a couple years' back. Here's good info for those interested in the True Picture: Inequality.org.
silvershadow
(10,336 posts)whatthehey
(3,660 posts)That's why sensible folks use aggregate data not personal anecdotes. The latter is good only for selling snake oil and patent nostrums not for sober analysis.
TimPlo
(443 posts)A friend told me DU was a website that one could go to talk about Liberal issues with out having to have RW talking points like trying to pass off how poor are just whinny lazy people who just need pull their boot straps up. This post if more inline with GOPunderground.com
Recursion
(56,582 posts)When did that happen?
Octafish
(55,745 posts)...and you claim it's making life better for the 99-percent, something's wrong someplace.
My Good Babushka
(2,710 posts)making $50 more a year after an interval of FORTY years as if that's proof of some policy that is "working", and it's not. There is nothing to point to, no economic policy or program to show sustained growth and prosperity for working people is in effect. There is no evidence of any trajectory in this information. This is the vagary of the "free market", which is actually legislation bought for by the wealthiest to make sure the most money goes to the wealthiest.
That's like getting a .000625% annual raise for forty years in a row, it's like being frozen at 0 Kelvin. If that happened to you, you'd be flipping tables.
snowy owl
(2,145 posts)Read more: What does the current cost of living compare to 20 years ago? | Investopedia http://www.investopedia.com/ask/answers/101314/what-does-current-cost-living-compare-20-years-ago.asp#ixzz47tTJp6w8
Follow us: Investopedia on Facebook
Good jobs have become low-pay service jobs. More children in poverty than ever before. Don't post crap please. There's a bigger picture.
Attorney in Texas
(3,373 posts)

Todays_Illusion
(1,209 posts)in the U.S. can no longer buy a home. How is that a reflection of improvement?
Recursion
(56,582 posts)What was wrong then?