2016 Postmortem
Related: About this forumThe Polling Paradox: How To Read the Numbers (Quinnipac related)
https://www.bloomberg.com/politics/articles/2015-07-22/the-polling-paradox-how-to-read-the-numbersBy Ken Goldstein (Professor of Politics at USF)
-------------
Do you believe, as the Quinnipiac Poll released Wednesday on a set of battleground states showed, that Bush as well as Marco Rubio and Scott Walker are besting Clinton by five percentage points in Colorado, six percentage points in Iowa, and three percentage points in Virginia.
...
Why? Fundamentally, the distribution of party identification and past voting trends tell us a lot about the basic political terrain and predispositions in a state. Predispositions in a state can change. West Virginia used to be reliably Democratic and Vermont reliably Republican, but there are rarely enormous jumps from year to year. There is some disagreement among pollsters about whether to weight to party identification, but an important factor to look at with any poll is the partisan distribution of the sample and how it compares to previous similar elections.
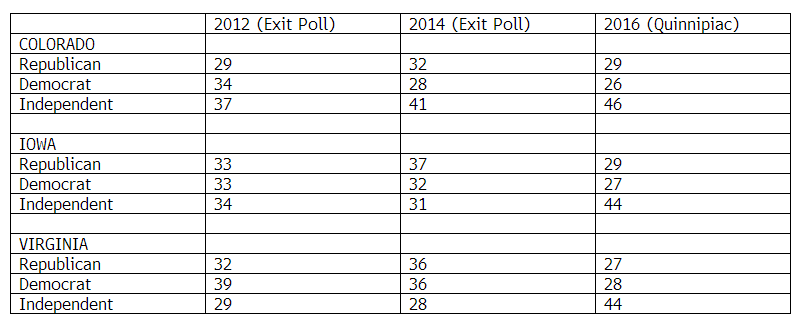
With a huge hat tip to Quinnipiac for being so transparent with their methodology, we can compare the partisan distributions in their state polls to previous years. Looking at exit poll results, which are generally, but not completely comparable to phone poll findings, we see that the electorate in the Quinnipiac polls in all three states looks more Republican and more like the 2014 mid-term electorate than the 2012 mid-term electorate. As the table below shows, Democrats went from a five percentage point advantage in Colorado in 2012 to a four percentage point deficit in 2014. The Quinnipiac Survey has Republicans up by three percentage points now. While the general election electorate in 2016 may not be as Democratic as it was in 2012 (can the eventual Democratic nominee replicate the message and mobilizing muscle of the 2012 Obama campaign?) it is unlikely to look so similar to the Republican leaning 2014 mid-term electorate.
So, while we actually don’t know what truth is – except on the day after the election, there are some things that you can do to make sense of political polls. See if state results make sense when compared to other states and to national polls and look at the composition of the electorate. The nature of the times and muscular mobilization efforts can change the shape of electorates at the margin, but be wary of results that look fundamentally different from previous years.
-----------
Good article on how to question polls, especially those that appear to contradict national trends.
On edit: in case you don't see the issue with the polling numbers in the chart, Quinnipac's distribution across D,R and I voters mirrors the 2014 midterms as opposed to being closer to the 2012 presidential election. This is problematic as there is a significant portion of people who vote in the presidential election versus midterms. Basically, Quinnipac assumes the Republican "wave" in 2014 is a long-term change in voter demographics, even in presidential years when turn out is much higher. Of course, under those assumptions, our Democratic candidates don't perform well.
 = new reply since forum marked as read
Highlight:
NoneDon't highlight anything
5 newestHighlight 5 most recent replies
= new reply since forum marked as read
Highlight:
NoneDon't highlight anything
5 newestHighlight 5 most recent replies
DemocratSinceBirth
(99,711 posts)
Godhumor
(6,437 posts)I certainly hope 2016 doesn't mirror 2014, heh.
still_one
(92,394 posts)about Gilmore or Webb. It sounds quite strange since both Gilmore and Webb are from Virginia, and both ran for public office in Virginia, like Governor for Gilmore and Senator for Webb, and both are state wide offices
kcjohn1
(751 posts)I could easily see this presidential election be closer to mid-term than 08/12. Obama was great campaigner and he got people to come out to vote. 08 was highest turnout since '68.
Assuming '16 will be like '08 or '12 is crazy. Naturally governing party has enthusiasm gap, and having Bush/Clinton will only drive rapid Republicans to the polls.
DemocratSinceBirth
(99,711 posts)Mid term participation has always been historically lower, much, much lower regardless of the candidates:

But I agree we shouldn't run from negative news but treat each poll as a data point.
kcjohn1
(751 posts)There is huge difference between presidential/midterm elections. I was trying to get the point across that instead of 60%+ turn out, turnout would be closer to 50-55%, with more enthusiasm on the republican side.
Generally speaking, non voters lean Dems 2-1. So 5% drop in turnout (from '12) would result in 3.3% decline in national vote for Dem candidate. This alone would put Ohio/FL/VA in Republican corner.
DemocratSinceBirth
(99,711 posts)And the lowest G E participation since they kept those figures is 52%.
And HRC is much more popular among Dems than Bush lll is among Republicans... That's why HRC is leading her race by 40 points while Bush is running behind a clown.
kcjohn1
(751 posts)Scenario I used was 54% presidential turnout (down 5% from 59% in '12).
This scenario assumes she wins dems/republicans/independents same ratio as Obama won. After 8 years it will be very tough to repeat. IMO she will need to destroy the opponent by going negative, and that will depress voter turnout. If, and its a big IF Republicans can put out there a sane looking candidate (Bush, Walker, Kasich) she will have hard time winning
ericson00
(2,707 posts)Jeb is going to cringe when at the debates, she refers to him not as "my opponent" but "governor Bush" or "Mr. Bush."
DemocratSinceBirth
(99,711 posts)Three scenarios (simulations) and she wins in every one:
https://www.bloomberg.com/politics/articles/2015-06-22/the-real-math-behind-hillary-clinton-s-candidacy
And she is a even money at the gaming sites. The generic Dem is 3-2. The closest Republican is 5-1:
http://www.predictwise.com/politics/2016president
I like my hand better than their hand.
Godhumor
(6,437 posts)And if you read the article, the basis for discussion is that the WP just came out with a poll showing Clinton as +10 to Bush. It is obvious either one or both of the polls is wrong. Considering demographics, it is a lot more likely the Quinnipac poll is an outlier.
DemocratSinceBirth
(99,711 posts)Adrahil
(13,340 posts)DemocratSinceBirth
(99,711 posts)For instance look at the participation for Reagan-Mondale and Bush Pere-Dukakis...HRC is at least as exciting as them and they goosed participation by over a third...
Adrahil
(13,340 posts)it actually WILL be. I mean anything COULD happen, but it's not what I'd put my money on.
Remember Unskewed Polls in 2012? They postulated an unlikely electorate too, and were so wrong it hurt. 
She may not be as inspiring as PBO, but I personally find HRC pretty exciting.
DemocratSinceBirth
(99,711 posts)Sixteen of the last sixteen general elections have shown a marked increase in participation...That's a trend...Also, that is only for what we have records for...
As to HRC she's exciting enough and I do think some women want to make history...
kcjohn1
(751 posts)Participation has gone up to 60% couple of times and has fall down to mid 50%.
The one trend is that for every high presidential election, the next results in lower. For example Carter had 65% in 76 to win but it went down to 55% in next election cycle. Clinton election resulted in 61% participation rate, but down to 53% in his second. Bush had 55% his first, and surprisingly bucked the trend by going to 61% in his second (tightly contested). Obama had 63% and only went down to 59%.
All the macro events are going against Dem candidate. After 8 years in charge, what exactly will be bringing voters out? There is no Iraq war or Bush to vote against. Naturally, the cycle suggests mid 50% participation rate.

dsc
(52,166 posts)but even the small ones are vastly bigger than the one suggest by Q in its poll.
ericson00
(2,707 posts)that school is always trying to get more money, they're a business. I know people whose kids went there, and they describe Quinnipiac University as a business. They just spent hundreds of millions of dollars to build a new arena, dorms, buy up off-campus houses but they're only 8000 and only known for subjects like physical therapy, occupational therapy, ie this isn't Harvard, or UConn.
DemocratSinceBirth
(99,711 posts)ericson00
(2,707 posts)I mean didn't that school have a dropout who called in a fake bomb threat? saw that on the news
DemocratSinceBirth
(99,711 posts)
fizzgig
(24,146 posts)pretty good pay for a market research call center.
ericson00
(2,707 posts)yea how worth it

sadoldgirl
(3,431 posts)The state was much more purple in 2012, than it was in
2014. In 2016 it will be indeed up to the independents,
who have grown in numbers very fast.
The West is not in anyones pocket; it distrusts all
government, no matter which party you look at. Yes,
because of that it may turn red again.
DemocratSinceBirth
(99,711 posts)eom
sadoldgirl
(3,431 posts)to leave the country. You guys cannot do this
to the rest of us!
DemocratSinceBirth
(99,711 posts)On a serious note we have cut our consumption already.

Tommy2Tone
(1,307 posts)No Republican can win without getting some of the Hispanic vote and that is not happening. Then there is the fact that this is a divided country and polling will always be +/ - 5 at the worse. I also wonder it they included the Democrats that don't like Hillary but when it comes down to it I don't believe they will vote for any of the Republicans.
still_one
(92,394 posts)Godhumor
(6,437 posts)But the PPP poll isn't the one that will be in the news cycle this week, I am sure.
fizzgig
(24,146 posts)quinnipaic does rdd (random digit dialing) and has live callers, while ppp uses voter registration lists for their sample and robocalls. looks like they both survey either all registered voters for some and only likely voters for others. the shift from registered to likely usually occurs as the election is drawing near.
quinnipaic called me before the mid-terms, but i screen my calls and didn't answer. however, they left me a message that they would try again later and that's why i answered the second time. i've been in a market research call center for seven years and was more than happy to help the kid out. 15-minute cell surveys on a sunday are hard to get and he did a great job.
DemocratSinceBirth
(99,711 posts)Polling is as much art as its science...
Cosmocat
(14,572 posts)As noted, you can't base a model on the mid term.
But, you can't base the model on the last two presidentials, either.
08 was defined by iraq and bush fatigue, which was the primary factor in the democrats getting power in both chambers along with the POTUS. Strongest D wins in decades and based on the AGAINST with Bush.
12 was tighter for president and was much less favorable with the house and senate to the president's party.
This election, Ds face the tide with having a D in the white house - which will tamp down turnout for Ds and strengthen turnout for Rs.
Still a LONG way to do go, and the actual candidates will define the race for potus, but it isn't favorable for a D strong D win and the house and senate aren't favorable, either.
People can say they hate negative politics all they want, but reality is the energy that drives elections is greater on the against than for the for.